
Ripple Resumes a Downtrend as It Retraces Above the Breakout Level of $0.41
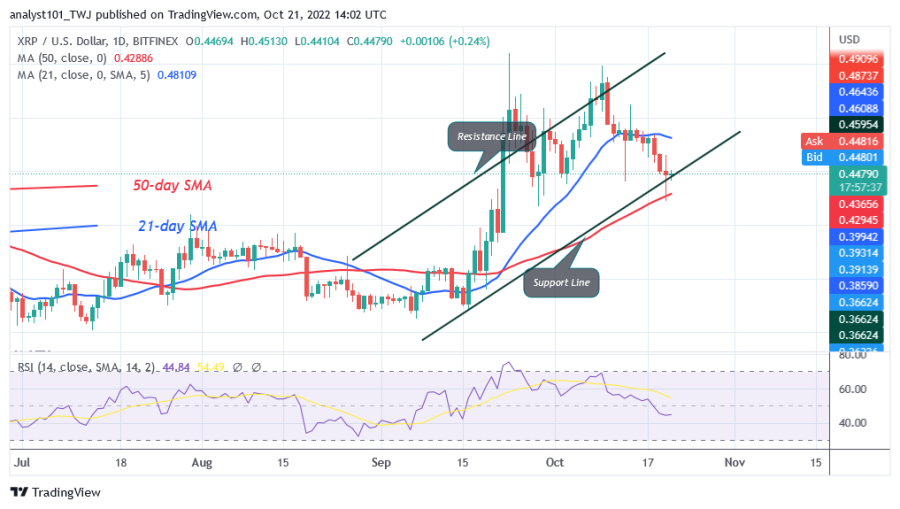
Ripple (XRP) is in a downtrend as the price of the cryptocurrency breaks below the moving average lines. The cryptocurrency has broken below the breakout level of $0.41, but has come back. XRP is now trading between the moving average lines.
The altcoin will be forced to move between the moving averages. XRP will start trending again when the range boundaries are broken. For example, if the bears break the 50-day line SMA, XRP will drop to a low of $0.38. On the upside, the altcoin will regain the previous high of $0.55 if buyers push the altcoin above the 21-day line SMA. In the meantime, XRP is trading at $0.44 at the time of writing.
Ripple indicator analysis

Ripple has retreated to the 44 level of the Relative Strength Index for the 14 period. This means that it is in a downtrend and could fall further. The altcoin might be back within a trading range as the price bars are between the moving average lines. After the recent decline, XRP is in a bullish momentum above the 40% area of the daily stochastic. However, the bullish momentum has remained stable. The bulls and bears are in a price battle above the $0.41 breakout level.
Technical indicators:
Major Resistance Levels – $0.80 and $1.00
Major Support Levels – $0.40 and $0.20
What is the next move for Ripple?
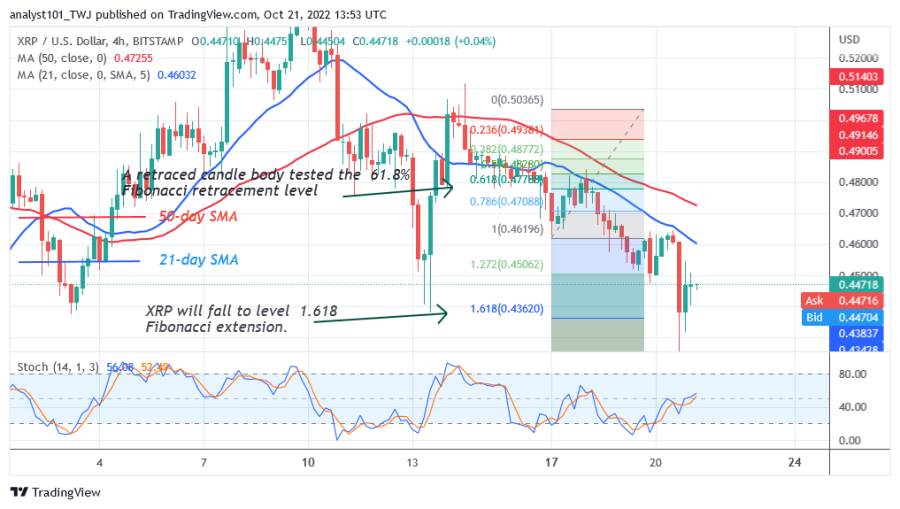
The cryptocurrency has been on a downtrend after a failed attempt to break through resistance at $0.55. On October 14, buyers pushed the altcoin to the high of $0.50. After the upward correction, the cryptocurrency value fell sharply. On the 4-hour chart, XRP fell to the low of $0.4225 and rebounded. The altcoin is now fluctuating above the support of $0.43.
Disclaimer. This analysis and forecast are the personal opinions of the author and are not a recommendation to buy or sell cryptocurrency and should not be viewed as an endorsement by CoinIdol. Readers should do their own research before investing.
Source: Read Full Article