
Chainlink Is in a Sideways Move as It Reaches Bearish Exhaustion
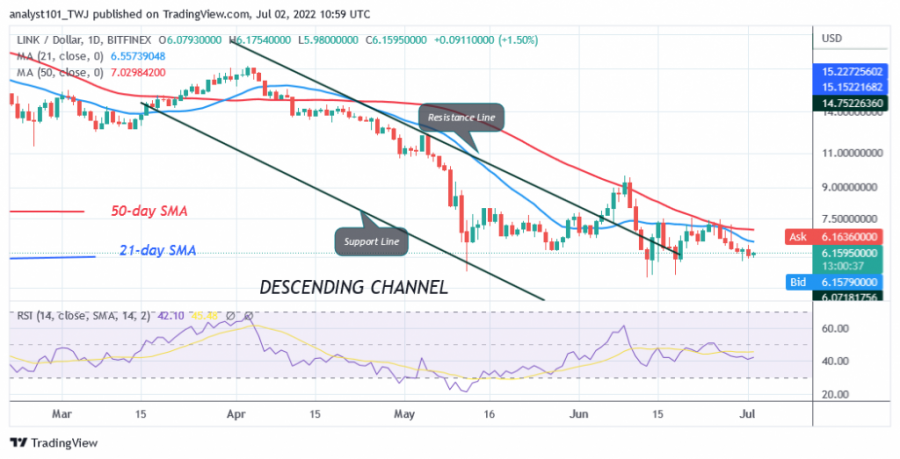
Since June 13, the price of Chainlink (LINK) has been in a sideways movement. However, last week the cryptocurrency declined after rejecting the high of $7.47. The altcoin fell to a low of $5.93 and then rose again. For the rest, Chainlink fluctuates between $5.30 and $7.50.
Support at $5.30 has held as bulls defend the lower price level. The long candle tails indicate that the current support is a strong buy point. A price rally will push the altcoin above the moving averages. The bullish momentum will extend to the resistance at $9. Chainlink will resume its uptrend when $9 resistance is broken.
Chainlink indicator reading

Chainlink is at level 42 on the Relative Strength Index for period 14, indicating that the altcoin is in a downtrend and could continue to fall. LINK price bars are below the moving averages, indicating a price decline. LINK is above the 40% range of the daily stochastic. The price is in an upward momentum.
Technical indicators:
Major Resistance Levels – $30 and $35
Major Support Levels – $10 and $5
What is the next move for Chainlink?
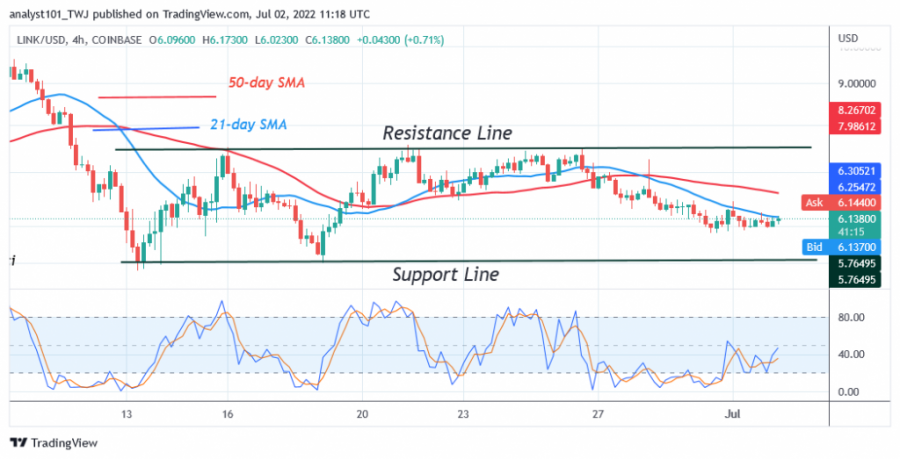
Chainlink has been in a sideways trend since June 13. For more than two weeks, the cryptocurrency has been fluctuating between $5.75 and $7.50 price levels. The altcoin will develop a trend when the fluctuation ranges are broken. In the meantime, the price action is characterized by small indecisive candles called doji.
Disclaimer. This analysis and forecast are the personal opinions of the author and are not a recommendation to buy or sell cryptocurrency and should not be viewed as an endorsement by Coin Idol. Readers should do their own research before investing funds.
Source: Read Full Article