Bitcoin Cash Analysis: Bulls Aim Upside Break To $150
Bitcoin cash price is climbing above $115 against the US Dollar, similar to bitcoin. BCH/USD could start a fresh surge if it clears the $122 level.
Bitcoin Cash Price Analysis
Bitcoin cash price formed a decent support base above the $105 level. BCH started a recovery wave and was able to clear the $112 resistance zone.

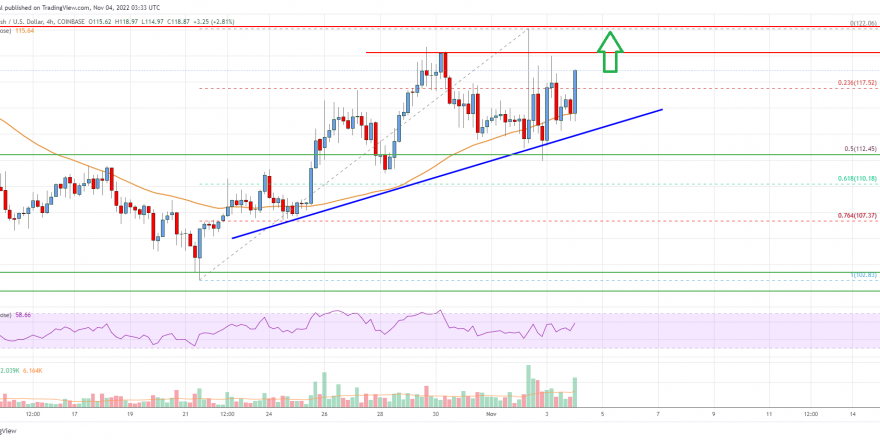
The price climbed above the $115 and $118 resistance levels. It tested the $122 zone and traded as high as $122.06. The price is now correcting gains and trading below $120. There was a move below the 23.6% Fib retracement level of the upward move from the $102 swing low to $122 high.
An immediate support on the downside is near the $116 zone and the 55 simple moving average (4-hours). There is also a major bullish trend line forming with support near $115 on the 4-hours chart of the BCH/USD pair.
The next major support is near the $112 level or the 50% Fib retracement level of the upward move from the $102 swing low to $122 high, below which the bears might aim $105. The next target for them may perhaps be near the $100 level.
On the upside, the price is facing resistance near the $120 level. The next major resistance is near the $122 level, above which the price may perhaps rise towards the $135 level. Any more gains above $132 and $132 could set the pace for a move towards the $150 level in the coming days.

Bitcoin Cash Price
Looking at the chart, bitcoin cash price is now trading above the $112 zone and the 55 simple moving average (4-hours). Overall, the price must clear $120 and $122 to continue higher in the near term.
Technical indicators
4 hours MACD – The MACD for BCH/USD is slowly gaining pace in the bullish zone.
4 hours RSI (Relative Strength Index) – The RSI for BCH/USD is above the 50 level.
Key Support Levels – $115 and $112.
Key Resistance Levels – $120 and $122.
Source: Read Full Article