Tron (TRX) Price Analysis: Fresh Increase To $0.072 Seems Likely
Earn Your First Bitcoin Sign up and get $12 Bonus Referral bonus up to $3,000
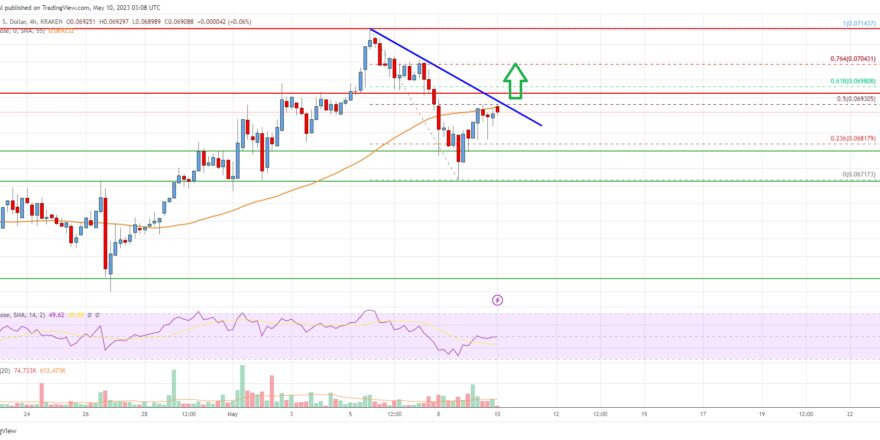
- Tron price started a fresh increase from the $0.0670 level against the US Dollar.
- TRX price is now trading near $0.0692 and the 55 simple moving average (4 hours).
- There is a major bearish trend line forming with resistance near $0.0694 on the 4-hours chart (data feed via Kraken).
- The pair could continue to move up if it breaks the $0.070 resistance zone.
TRON price started a fresh increase above $0.0685 against the US Dollar, similar to Bitcoin. TRX’s price could rise further if it clears the $0.070 resistance.
Tron Price Analysis

After a downside correction, Tron price found support near the $0.0672 zone against the US Dollar. TRX’s price formed a base and recently started a fresh increase from the $0.0671 low.
There was a break above the $0.0675 and $0.0680 levels. The price climbed above the 23.6% Fib retracement level of the downward move from the $0.0714 swing high to the $0.0671 low. TRX is now trading near $0.0692 and the 55 simple moving average (4 hours).
On the upside, TRX is facing resistance near the $0.0694 level. There is also a major bearish trend line forming with resistance near $0.0694 on the 4-hours chart.
The trend line is close to the 50% Fib retracement level of the downward move from the $0.0714 swing high to the $0.0671 low. The next major resistance is near the $0.070 level. A close above $0.070 could send the price toward the $0.0720 resistance zone.
Any more gains might send TRX price toward $0.075, above which the price could even rise toward $0.078. On the downside, initial support is near the $0.0680 level. The next major support is now forming near $0.0670 or the recent low.
If there is a downside break below the $0.0670 support, the price might revisit the $0.0644 support. Any more losses might call for a move toward the $0.0620 zone in the near term.

Tron (TRX) Price
The chart indicates that TRX’s price is now trading near $0.0693 and the 55 simple moving average (4 hours). Overall, the price could continue to move up if it breaks the $0.070 resistance zone.
Technical Indicators
4 hours MACD – The MACD for TRX/USD is now gaining momentum in the bullish zone.
4 hours RSI – The RSI for TRX/USD is above the 50 level.
Key Support Levels – $0.0680 and $0.0670.
Key Resistance Levels – $0.0694, $0.070, and $0.0720.
Source: Read Full Article