TRON Maintains A Narrow Margin As Traders Show Indifference
TRON (TRX) price is falling below the 21-day line SMA. The cryptocurrency asset is between the moving average lines at the moment.
TRON price long term forecast: bearish
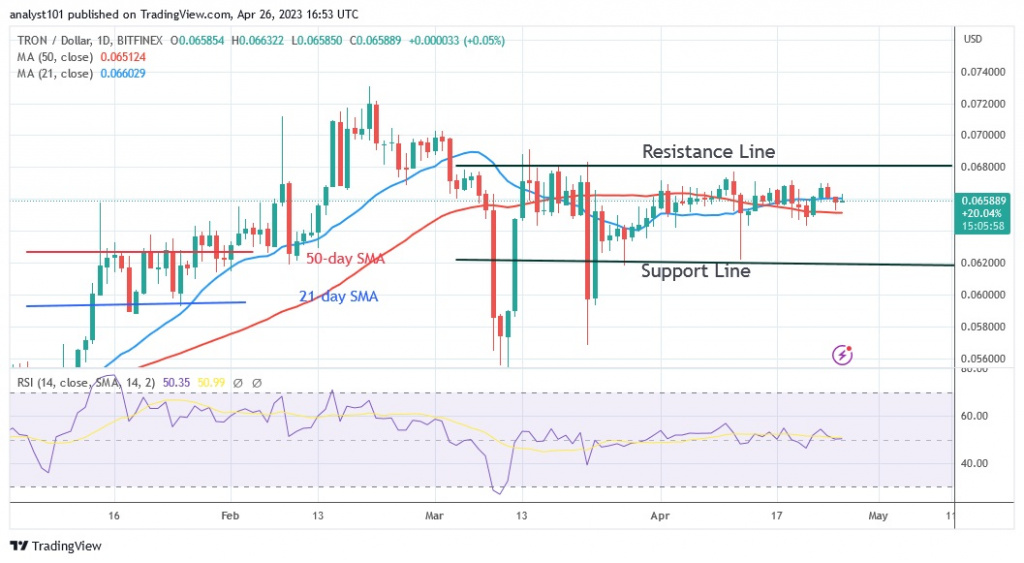
At the time of writing, the altcoin is currently trading at $0.065. TRON price has maintained a tight range between $0.062 and $0.065. This range has not been broken due to the presence of Doji Candlesticks. When Doji Candlesticks are seen, the price movement is hesitant. The candlesticks show that neither buyers nor sellers are sure about the price of the market. One downside is that we have already successfully beaten back the bears three times. The extended tails of the candlesticks show strong buying pressure at lower price levels.
TRON indicator display

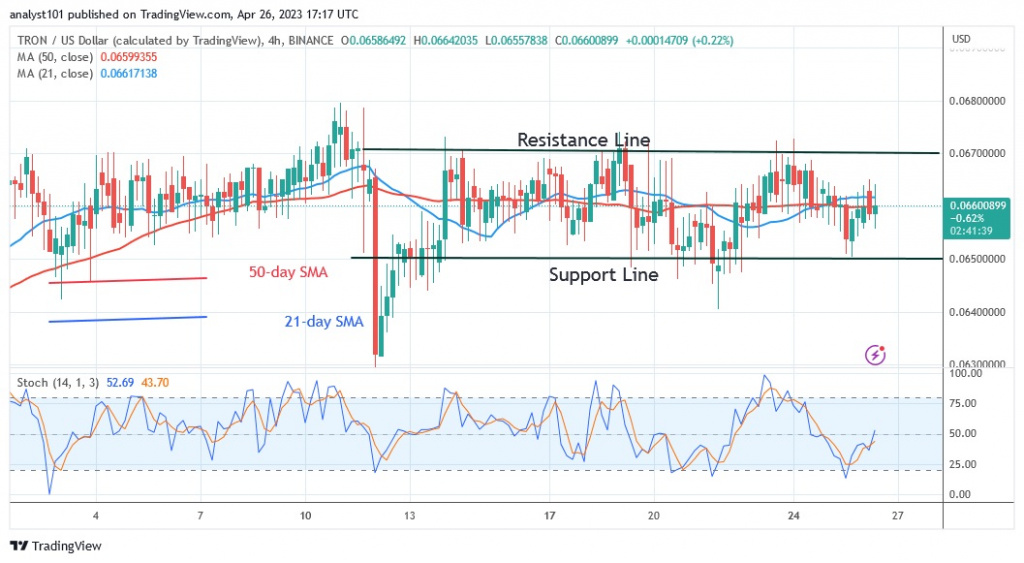
The Relative Strength Index for the 14 period is at 50 on TRON. Due to negligible price movement, the RSI is unchanged. This means that supply and demand are in balance. Price bars that are between moving average lines indicate that prices will continue to move sideways. The Stochastic on the daily chart shows that TRON currently has positive momentum above the 50 level.
Key supply zones: $0.07, $0.08, $0.09
Key demand zones: $0.06, $0.05, $0.04
What is the next direction for TRON?
TRX/USD has been moving in a range since March. Based on the Doji candlesticks, it is expected that the altcoin will continue to move in a range. If the altcoin bounces above the current support, it will trend.
Disclaimer. This analysis and forecast are the personal opinions of the author and are not a recommendation to buy or sell cryptocurrency and should not be viewed as an endorsement by Coin Idol. Readers should do their own research before investing in funds.
Source: Read Full Article