Stellar Lumen (XLM) Price Eyes Fresh Increase Above $0.092
Earn Your First Bitcoin Sign up and get $12 Bonus Referral bonus up to $3,000
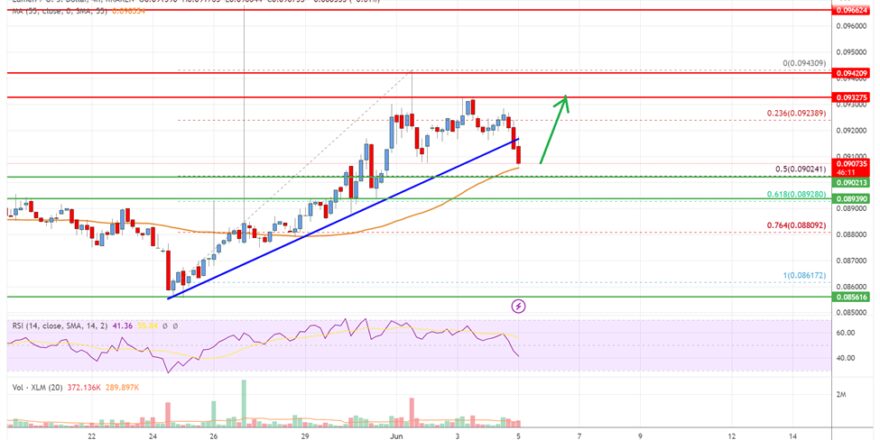
- Stellar lumen price started a downside correction from the $0.0945 zone against the US Dollar.
- XLM price is now trading above $0.090 and the 55 simple moving average (4 hours).
- There was a break below a key bullish trend line with support near $0.0916 on the 4-hour chart (data feed via Kraken).
- The pair could start another increase if it clears the $0.092 and $0.094 resistance levels.
Stellar lumen price is trading above $0.090 against the US Dollar, similar to bitcoin. XLM’s price must stay above the $0.090 support to rise again.
Stellar Lumen Price Analysis (XLM to USD)

After forming a base above the $0.085 level, Stellar lumen price started a fresh increase against the US Dollar. The XLM/USD pair broke the $0.090 resistance zone to move into a positive zone.
The price even cleared the $0.0920 resistance and the 55 simple moving average (4 hours). The upward move was such that the price spiked to $0.0940 before it corrected lower. There was a drop below the $0.092 support level. There is a break below the 23.6% Fib retracement level of the upward move from the $0.0861 swing low to the $0.0943 high.
Besides, there was a break below a key bullish trend line with support near $0.0916 on the 4-hour chart. However, the bulls were active near the $0.0920 level.
XLM is now trading above $0.090 and the 55 simple moving average (4 hours). On the upside, the price is facing resistance near the $0.092 zone. The next major resistance is near the $0.0945 level. A clear move above the $0.0945 level might send the price toward the $0.0965 level.
Any more gains could lead the price toward the $0.1000 level or even $0.1050. Initial support on the downside is near the $0.090 level or the 50% Fib retracement level of the upward move from the $0.0861 swing low to the $0.0943 high.
The next major support sits near the $0.0880 level. Any more losses could lead the price toward the $0.0865 level in the near term.

Stellar Lumen (XLM) Price
The chart indicates that XLM’s price is now trading above $0.090 and the 55 simple moving average (4 hours). Overall, the price could start another increase if it clears the $0.092 and $0.0945 resistance levels.
Technical Indicators
4 hours MACD – The MACD for XLM/USD is losing momentum in the bullish zone.
4 hours RSI – The RSI for XLM/USD is now above the 50 level.
Key Support Levels – $0.090 and $0.088.
Key Resistance Levels – $0.092, $0.0945, and $0.0950.
Source: Read Full Article