
Solana Holds Above $20 On Bearish Exhaustion
The price of Solana (SOL) has risen to its highest level, but is currently falling.
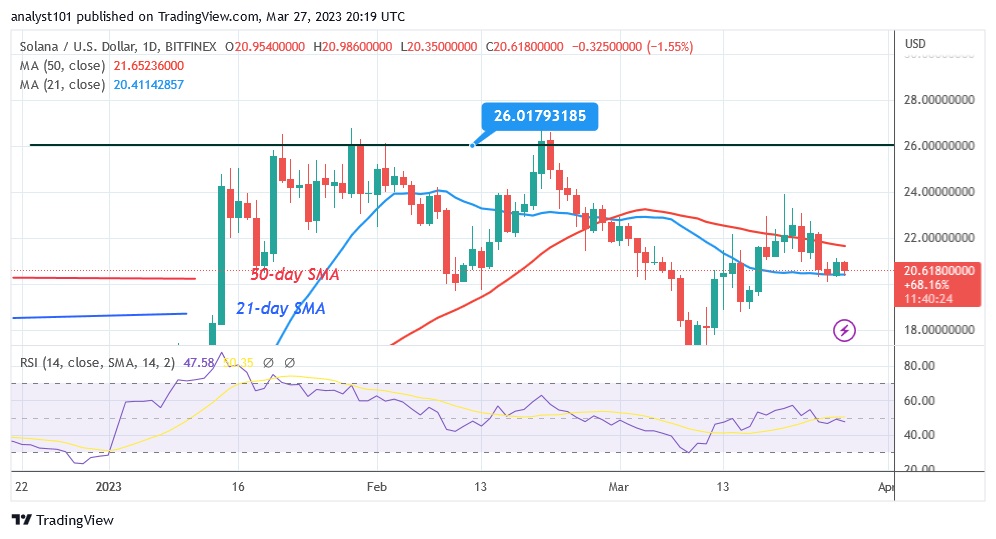
Solana price long term forecast: bearish
The altcoin fell below the moving average lines for the second time on March 20 after the upward correction was staved off. Altcoin fell despite being stopped between the moving average lines. Solana is currently trading between the moving average lines at $20.48. The upside correction is rejected at the high of $24 as the altcoin falls within the moving average lines. Solana will perform when the moving average lines are crossed. The state of the cryptocurrency will be forced into a range where the average lines are unbroken. For example, SOL will fall above the low of $16 when the 21-day moving average line is crossed. The cryptocurrency will resume its uptrend once the 50-day line SMA and the resistance at $24 are broken.
Solana price indicator analysis

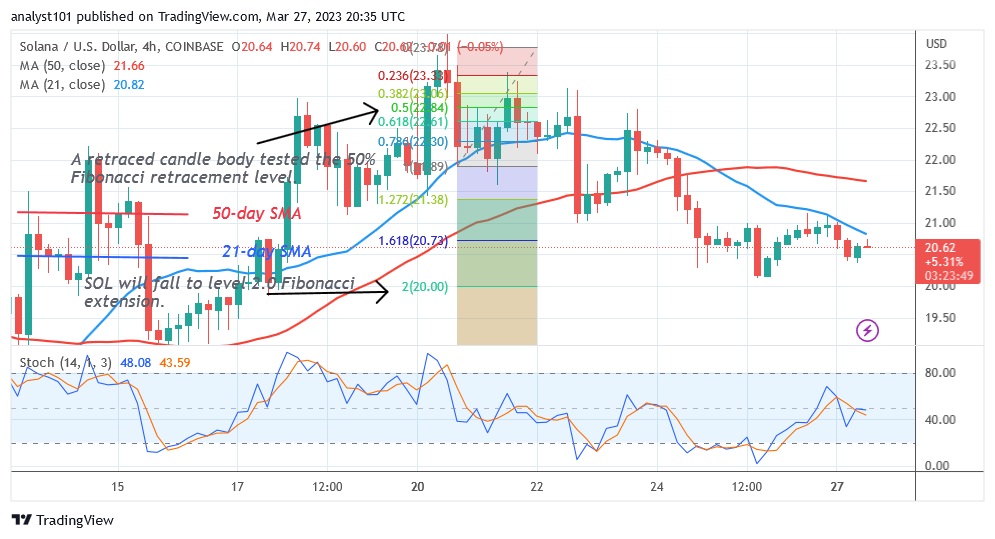
On the Relative Strength Index, the altcoin is at level 47. Solana is in a downtrend and could fall further. The fact that it is currently trading between the moving average lines suggests that a move within a certain range could take place. The altcoin is in a bearish momentum below the 40 level of the daily stochastic.
Technical indicators
Key supply zones: $60, $80, $100
Key demand zones: $50, $30, $10
What is the next move for Solana?
Bearish momentum has slowed as the cryptocurrency is trapped between moving average lines. Bearish fatigue has set in as Solana approaches oversold territory in the market. The upside will continue if the current support level at $20 holds.
Disclaimer. This analysis and forecast are the personal opinions of the author and are not a recommendation to buy or sell cryptocurrency and should not be viewed as an endorsement by CoinIdol. Readers should do their own research before investing in funds.
Source: Read Full Article