
Ripple Loses $0.33 Low as It Targets Strong Support at $0.25
Ripple (XRP) is in a downtrend as the price drops below the current support at $0.38. The bearish momentum has extended, breaking the previous low at $0.33.
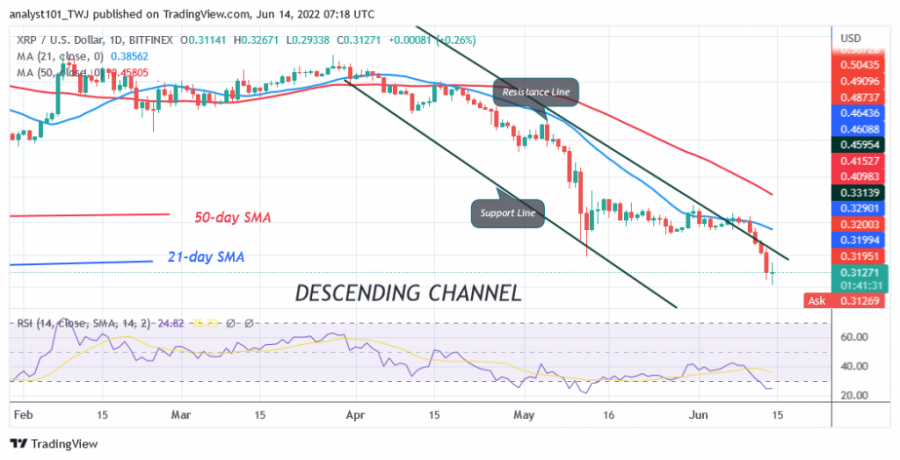
The recent drop was caused by buyers being unable to keep the price above the 21-day line SMA. Attempting to break the 21-day line SMA on May 30 and June 7, the bulls were met with resistance. The bears undercut the previous low at $0.33, signalling the resumption of the downtrend. On the downside, XRP/USD is likely to fall further to the low of $0.24. At the time of writing, XRP is trading at $0.31.
Ripple indicator analysis

Ripple has fallen to the 24 level of the Relative Strength Index for the 14 period. This indicates that the market has reached the oversold zone. Selling pressure is likely to ease as buyers emerge in the oversold area. XRP price bars are below the moving averages, indicating a further decline. XRP is below the 20% area of the daily stochastics. The daily stochastics indicate that the crypto is in the oversold area of the market. We expect an upward correction and consolidation above the current support.
Technical indicators:
Major Resistance Levels – $0.80 and $1.00
Major Support Levels – $0.60 and $0.40
What is the next move for Ripple?
Ripple has resumed selling pressure as bears break the previous low at $0.33. Meanwhile, on the May 12 downtrend, a retraced candle body tested the 78.6% Fibonacci retracement level. The retracement suggests that XRP will fall to the 1.272 Fibonacci extension level or $0.25. Based on the price action, XRP has fallen to the low of $0.31.

Disclaimer. This analysis and forecast are the personal opinions of the author and are not a recommendation to buy or sell cryptocurrency and should not be viewed as an endorsement by CoinIdol. Readers should do their own research before investing
Source: Read Full Article