
Ripple Holds above $0.32 as Buyers and Sellers Continue to Show Indifference
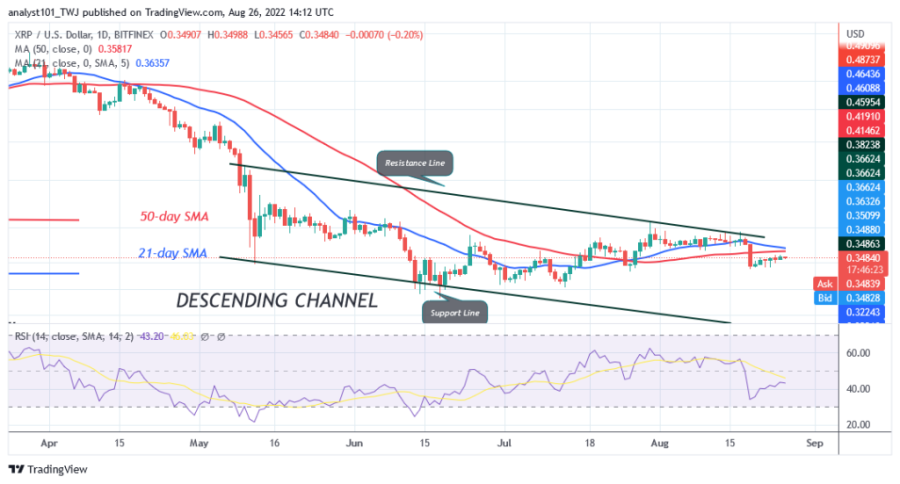
Ripple's (XRP) price movement has remained unchanged after the August 19 plunge. Over the past week, Ripple has traded modestly as the altcoin fluctuates between $0.32 and $0.35.
The reason for this price movement is the emergence of small indecisive candlesticks called doji and spinning tops. The candlesticks indicate that buyers and sellers are undecided about the direction of the market. Nonetheless, XRP will develop bullish momentum again as the price rallies and rises above the moving average lines. The bullish momentum will rise to retest the $0.38 and $0.41 resistance levels. Conversely, XRP will fall back to the previous low at $0.30 if the bears break below the current support.
Ripple indicator analysis

Ripple is at level 43 on the Relative Strength Index for period 14, with the RSI rising as the cryptocurrency makes an upward correction. However, XRP will decline as long as the price bars are below the moving average lines. The altcoin is below the 40% area of the daily stochastics. XRP is in bearish momentum.
Technical indicators
Key Resistance Zones: $0.40, $0.45, $0.50
Key Support Zones: $0.30, $0.25, $0.20
What is the next move for Ripple?
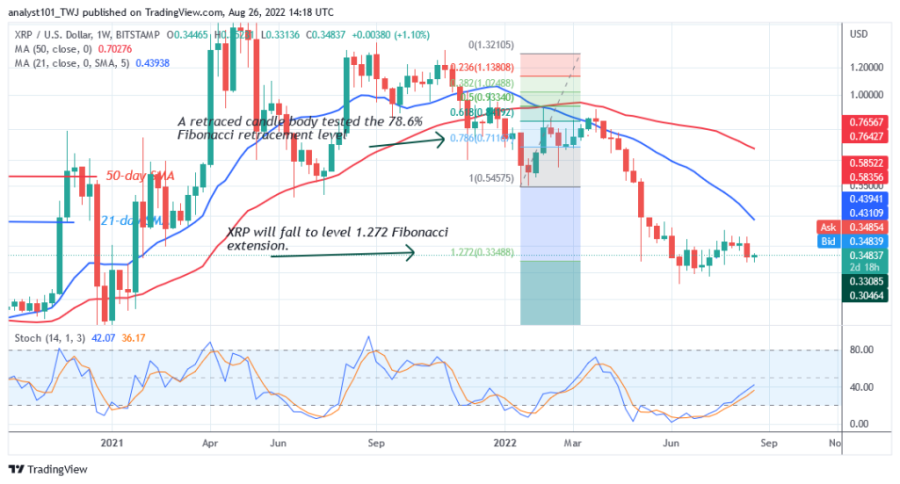
XRP/USD has remained stable above the $0.32 support. The price movement stagnated last week. On the weekly chart, a candlestick tested the 78.6% Fibonacci retracement level on March 28. The retracement suggests that the XRP price will fall to the Fibonacci extension level of $1.272 or $0.33. This analysis will become invalid if the price breaks above the moving average lines.
Disclaimer. This analysis and forecast are the personal opinions of the author and are not a recommendation to buy or sell cryptocurrency and should not be viewed as an endorsement by CoinIdol. Readers should do their own research before investing.
Source: Read Full Article