
Ripple Grapples with Downward Correction as Demand Dries up at Higher Price Levels
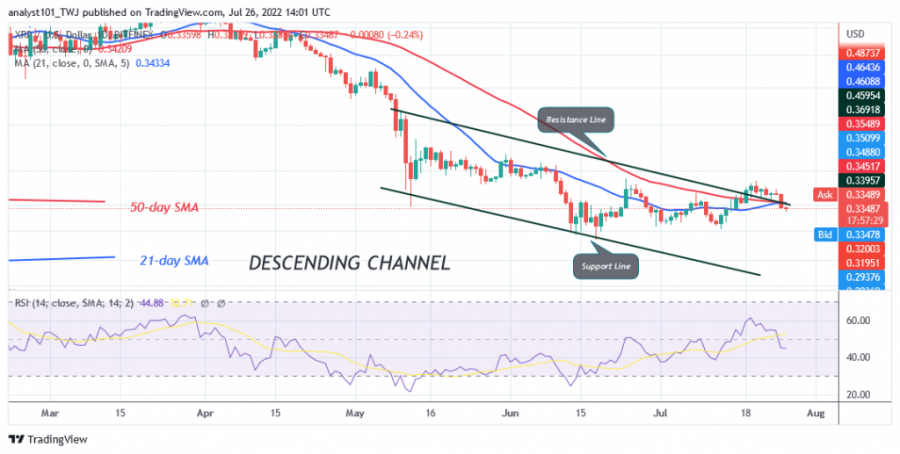
Ripple (XRP) has fallen as buyers have failed to keep the price above the high of $0.38. This is the second time XRP has faced the rejection of the $0.38 overhead resistance. The cryptocurrency was previously rejected at the $0.38 high on June 24.
The altcoin fell to a low of $0.30 as bulls bought the dips. Last week, XRP went through a downward movement after the recent rejection. The cryptocurrency’s upward movement peters out at higher price levels. Today, XRP is trading at $0.33 as the price falls below the moving average lines. Ripple will continue to decline and regain the previous low at $0.30.
Ripple indicator analysis

The cryptocurrency is at level 44 of the Relative Strength Index for the period 14. The altcoin is in the downtrend zone as it continues its downward correction. The cryptocurrency’s price bars have fallen below the moving average lines, signaling further downward movement. The altcoin is below the 80% area of the daily stochastic. This indicates that the market is in a bearish momentum. The 21-day line SMA and the 50-day line SMA are sloping south, indicating a downtrend.
Technical Indicators:
Key Resistance Zones: $0.40, $0.45, $0.50
Key Support Zones: $0.30, $0.25, $0.20
What is the next move for Ripple?
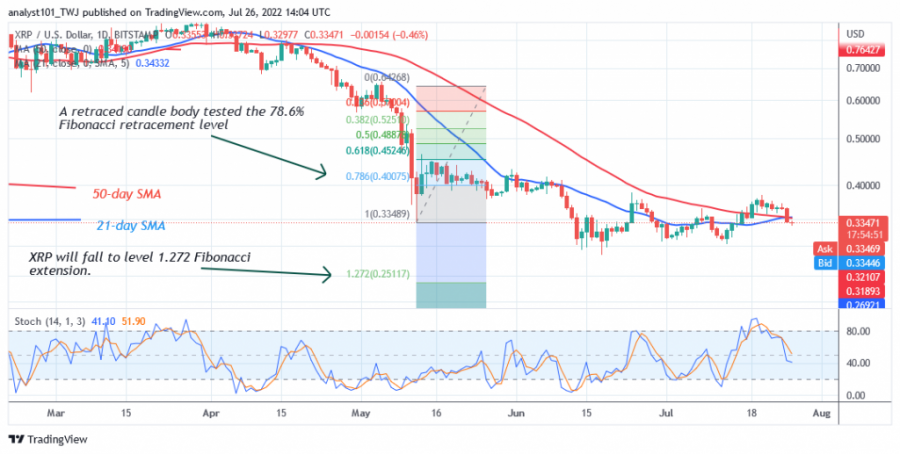
Ripple has started another round of selling pressure. The altcoin could hit the low of $0.30 again. However, the Fibonacci tool analysis will hold if the bulls fall below the $0.30 support. Meanwhile, on May 12 downtrend, a retraced candle body tested the 78.6% Fibonacci retracement level. The retracement suggests that Ripple will fall to the level of 1.272 Fibonacci extension and reverse gear or reach $0.25.
Disclaimer. This analysis and forecast are the personal opinions of the author and are not a recommendation to buy or sell cryptocurrency and should not be viewed as an endorsement by CoinIdol. Readers should do their own research before investing.
Source: Read Full Article