
Quant Reaches Oversold Region At Over $120
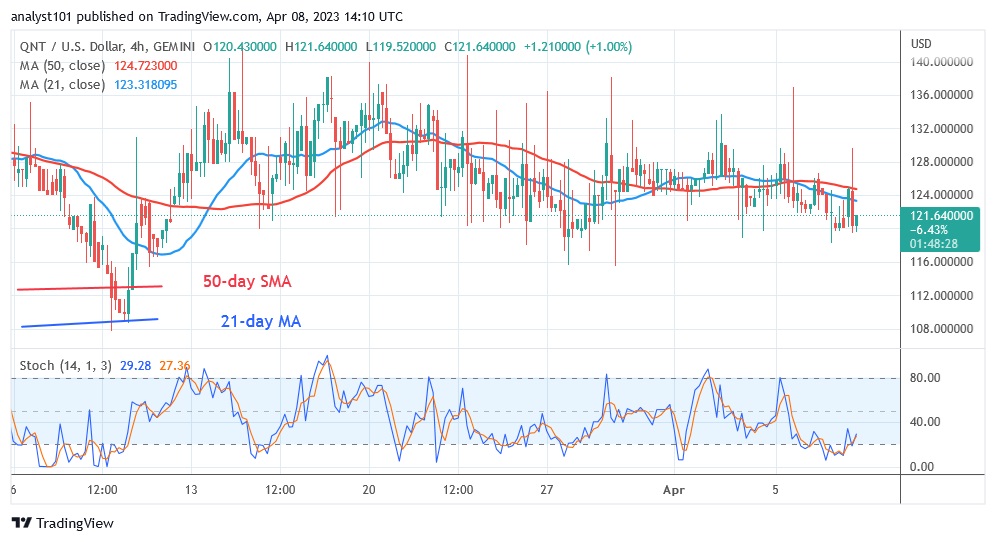
Quant (QNT) is falling below the moving average lines.
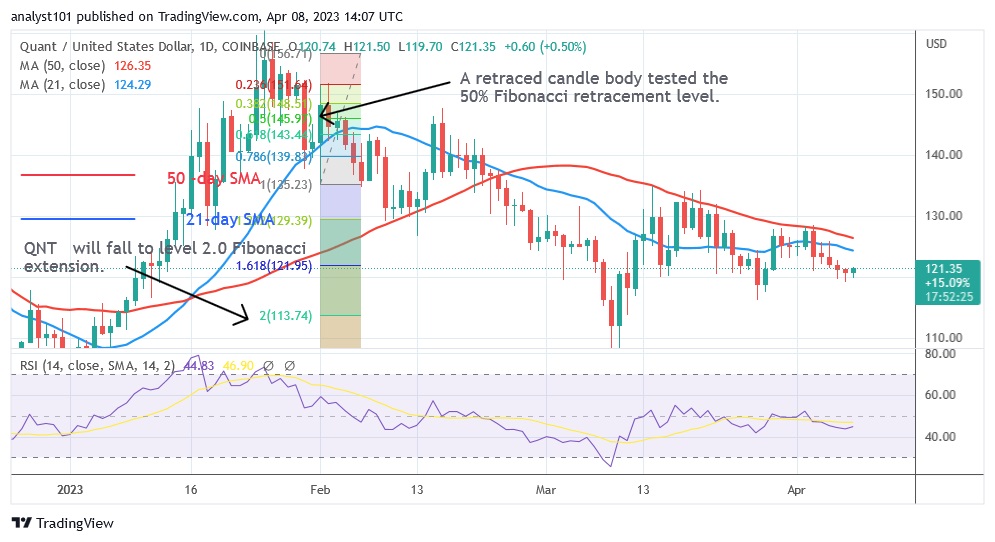
Quant long-term price forecast: declining
The cryptocurrency asset is currently selling for $121.26. The altcoin will start to rise again once the resistance level at $130 is reached. However, the buyers were not able to overcome the moving average lines and the resistance at $130. The recent decline is due to the crypto price being rejected at the 50-day line SMA on April 3. If the selling pressure continues, the downward momentum will continue to the previous low of $106. In the meantime, the market has moved into oversold territory. The altcoin might consolidate and recover after its negative peak is overcome.
Quant price indicator analysis

In period 14, QNT is at a Relative Strength Index level of 44.
Since the altcoin is currently in a bearish trend zone, it could decline.
Further decline could result from the cryptocurrency’s price bars being below the moving average lines. Quant will trade in the oversold zone if it falls below the 20 level of the daily stochastic. The altcoin will rise when buyers enter the oversold zone.
Technical indicators
Important supply zones: $140, $150, $160
Important demand zones: $120, $110, $100
What is the next step for Quant?
QNT has been trading in the bearish trend zone since March 9. The altcoin is expected to stay in the downtrend zone if it hits the resistance at $130. Currently, the cryptocurrency is at a low of $121. The bearish momentum will transfer to the previous low if the existing support is broken.
Disclaimer. This analysis and forecast are the personal opinions of the author and are not a recommendation to buy or sell cryptocurrency and should not be viewed as an endorsement by CoinIdol. Readers should do their own research before investing in funds.
Source: Read Full Article