
Polkadot Experiences Correction After Reaching $5.54: What's Next In Store?
Yesterday, Polkadot (DOT) reached its weekly high at $5.54 but subsequently started a corrective phase. In the past 24 hours, DOT has managed to retain 1.8% of its overall gains during that period. On the weekly chart, DOT exhibited a 3% price increase.
However, the technical analysis suggests that bears currently have the upper hand, with buying strength and demand remaining low. Despite this, if Bitcoin continues its upward movement toward the $28,000 level, several altcoins, including DOT, may also experience positive price action.

On the flip side, if sellers dominate, DOT could break below its crucial support level, strengthening the bearish sentiment in the upcoming trading sessions. The decline in the DOT market capitalization further indicates the prevailing low buying strength at the present moment.
Polkadot Price Analysis: One-Day Chart
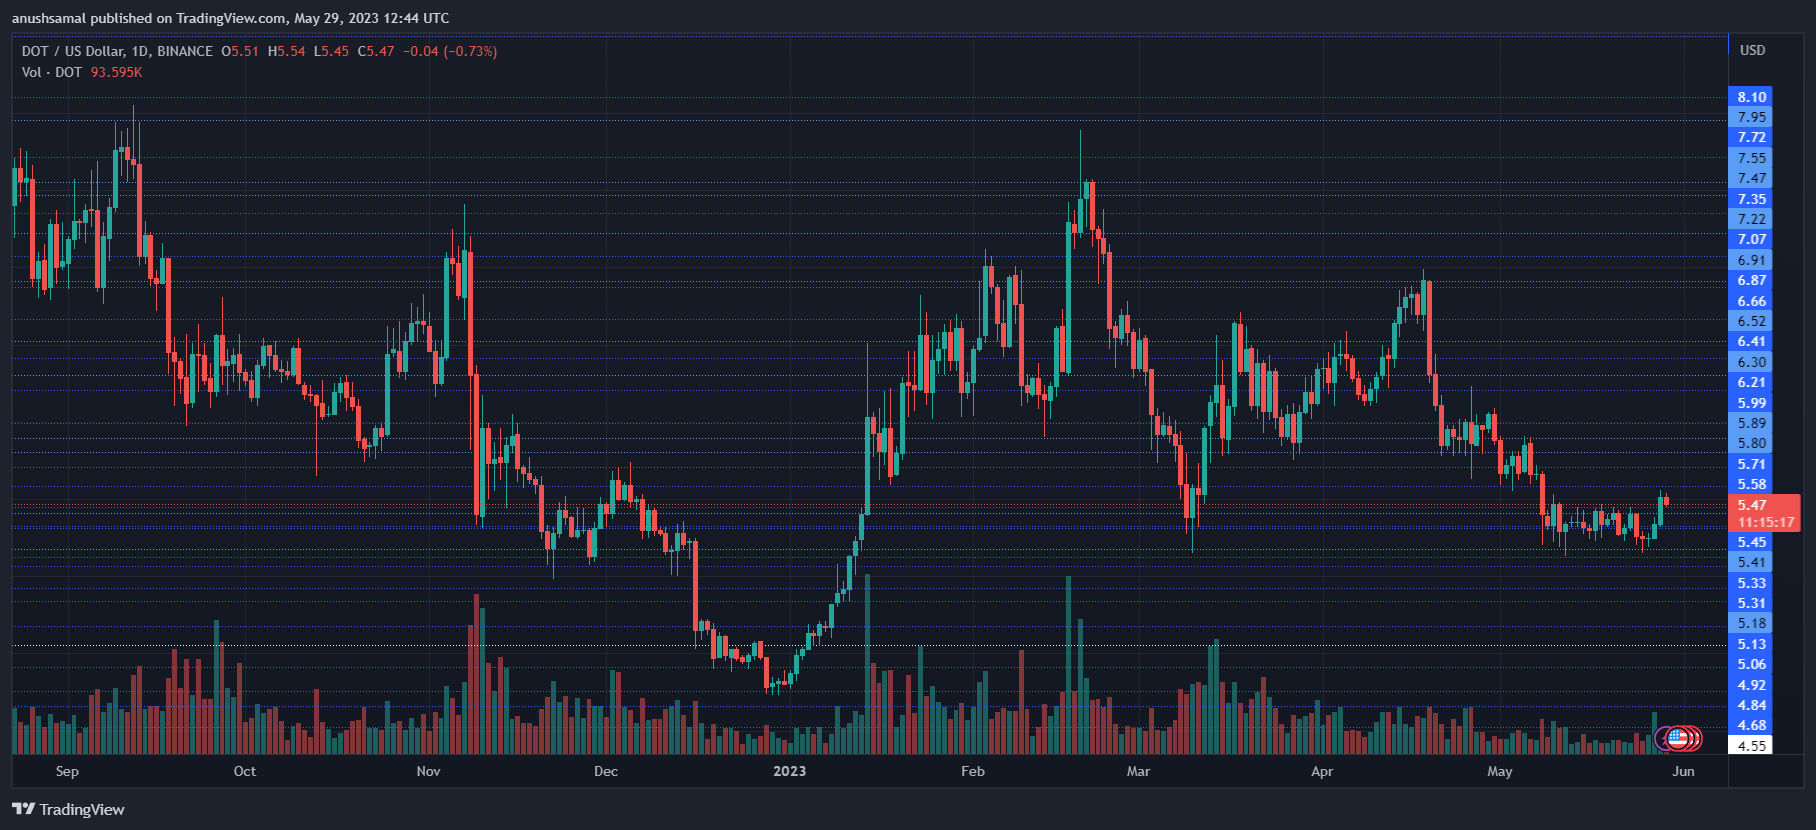
At the time of writing, DOT was trading at $5.47. Following a rejection at the $5.54 level, the altcoin has experienced a retracement on its chart.
The overhead resistance for DOT is currently positioned at $5.58. If the altcoin manages to surpass this resistance level, it could potentially reach $5.80. Despite the price correction, DOT has thus far maintained a position above the crucial support level of $5.40.
However, if sellers gain momentum, the price may drop below the vital support level of $5.40 and trade around $5.30. The trading volume of DOT in the previous session was bearish, indicating a decline in demand driven by the bears on the daily chart.
Technical Analysis
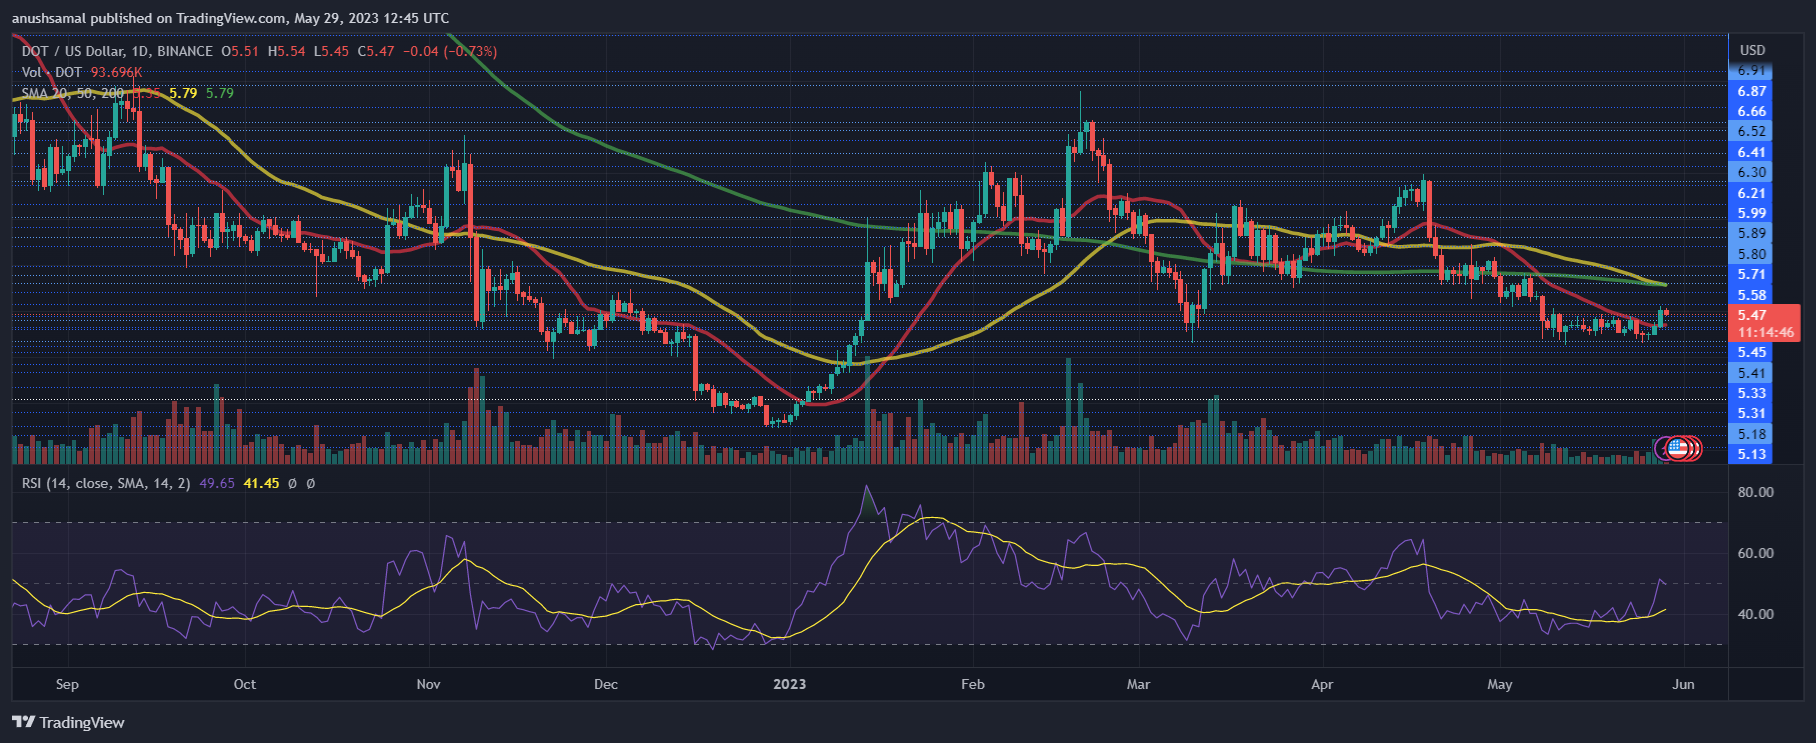
Throughout the month of May, DOT has experienced minimal demand on its chart. Although the Relative Strength Index (RSI) displayed signs of recovery initially, the depreciation of DOT led to a decrease in demand.
This suggests that buying strength did not enter the positive zone. Furthermore, the DOT price moved below the 20-Simple Moving Average (SMA) line, indicating that sellers have been driving the price momentum in the market.
If there is a slight increase in demand in the upcoming trading sessions, DOT may attempt to trade above the 20-SMA line, providing an opportunity for the bulls to regain control over the price.
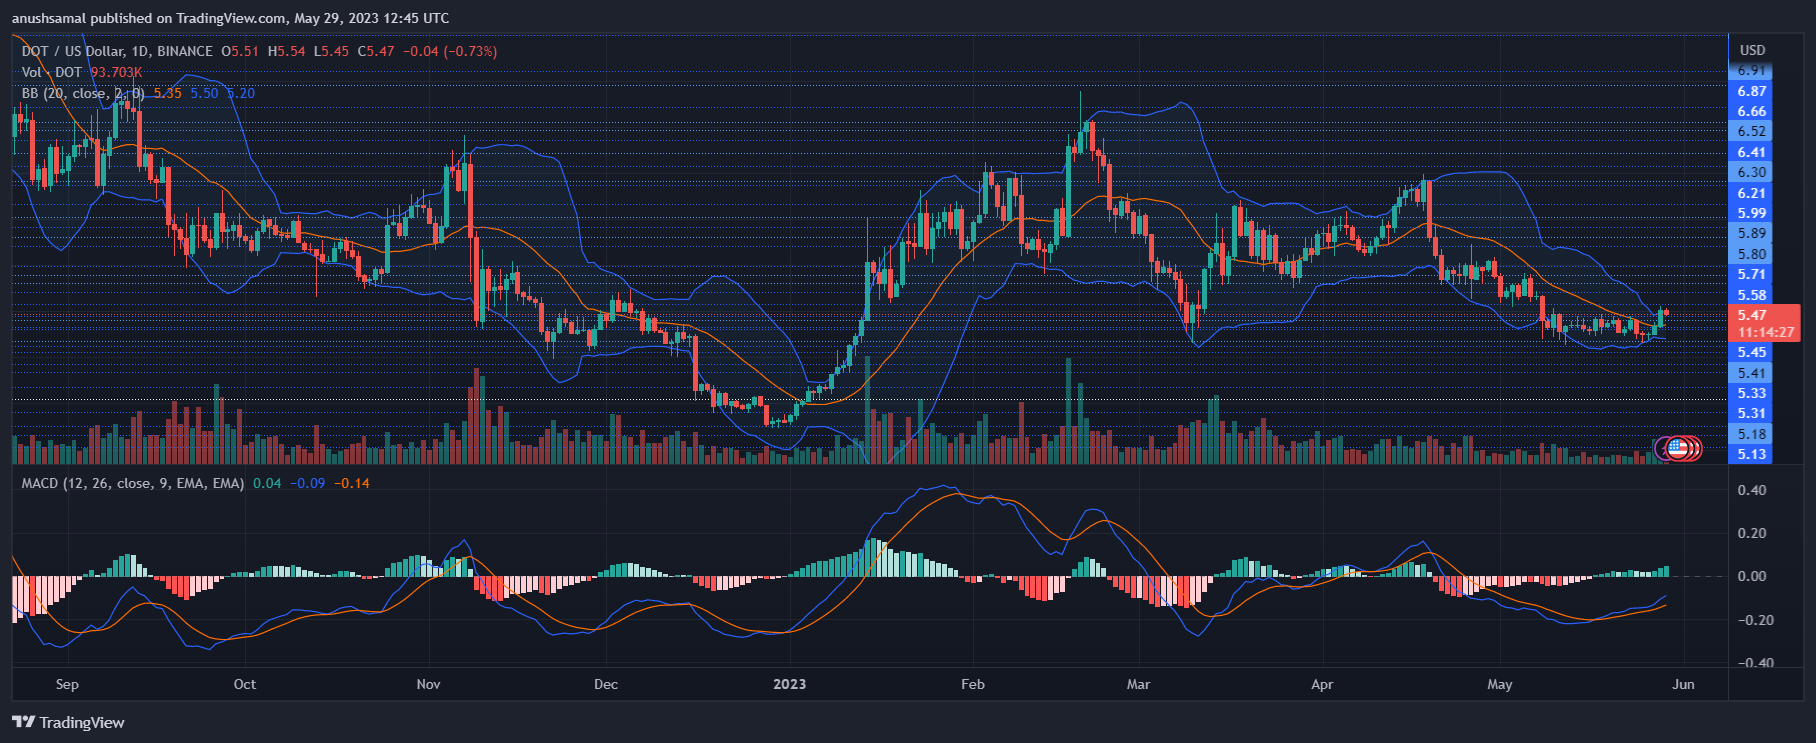
Although demand for Polkadot has declined, the chart still displays buy signals, suggesting the potential for a price increase. These buy signals are accompanied by an increase in demand, indicating a positive outlook.
The Moving Average Convergence Divergence (MACD) indicator, which reflects price momentum and trend changes, shows green histograms tied to buy signals.
Additionally, the Bollinger Bands, which measure price volatility and fluctuation, are constricted, suggesting that Polkadot may experience significant volatility in the upcoming trading sessions.
Source: Read Full Article