
Chainlink Collapses At $8.00 Resistance And Comes Under Renewed Selling Pressure
Chainlink (LINK) price has dropped below the moving average lines after being rejected at $7.80.
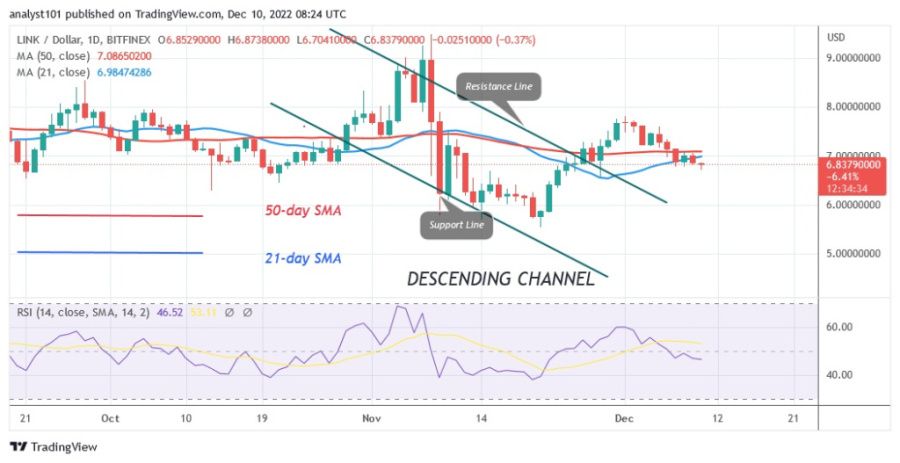
Chainlink price long-term analysis: bullish
On December 1, the uptrend was unable to overcome the $8.00 resistance level. Despite breaking above the moving average lines, the cryptocurrency price was stopped at the $8.00 resistance level. The $8.00 resistance level is the point where the market is overbought. The decline was triggered by the failure of buyers to penetrate the resistance area. If the current resistance is broken, the cryptocurrency value would have risen to $9.48. However, the current selling pressure could cross both the moving average line and the low at $6.54.
Chainlink indicator display

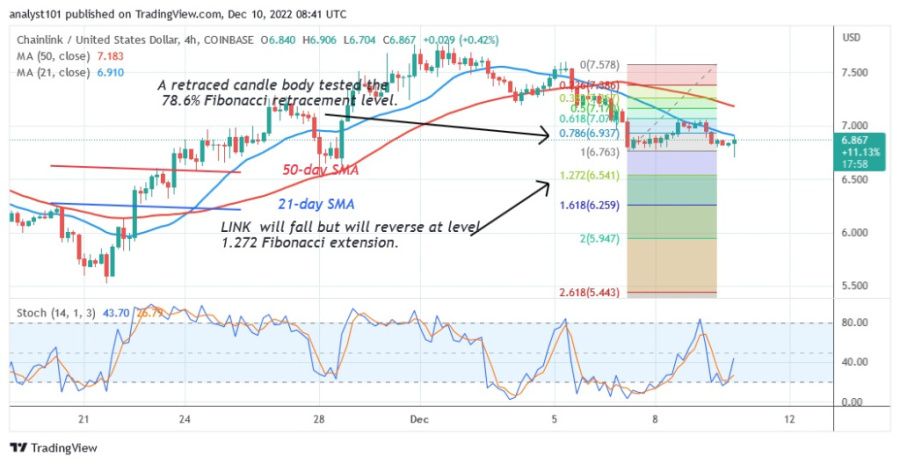
Chainlink’s Relative Strength Index is at 46 for the 14 period, and the recent slump has pushed the altcoin into the negative trend zone. The price of the cryptocurrency is below the moving average line, indicating a possible decline. On the 4-hour chart, LINK is below the 40 level of the daily stochastic. This indicates that it is moving in a bearish direction.
Technical indicators
Key resistance levels – $30 and $35
Key support levels – $10 and $5
What is the next move for Chainlink?
Chainlink is trading in an oversold area of the market. Bearish fatigue has been reached in the current downtrend. Chainlink reversed the downtrend on December 7 and a candlestick has tested the 78.6% Fibonacci retracement line. According to the correction, LINK will fall but reverse at the level of 1.272 Fibonacci extension or $6.
Disclaimer. This analysis and forecast are the personal opinions of the author and are not a recommendation to buy or sell cryptocurrency and should not be viewed as an endorsement by Coin Idol. Readers should do their own research before investing in funds.
Source: Read Full Article