
Binance Coin Moves Sideways As It Reclaims $340 High
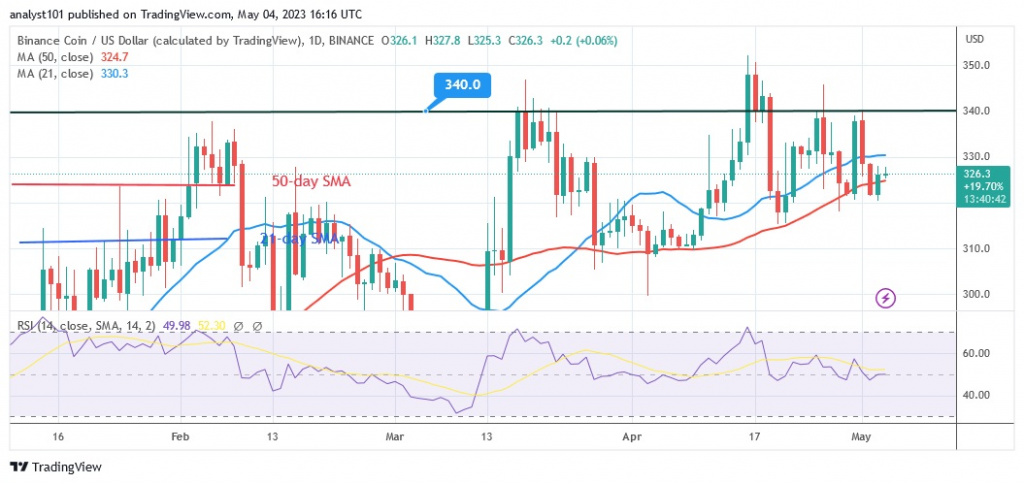
The price of Binance Coin (BNB) has crossed the 50-day line SMA despite its sideways movement. In other words, BNB is currently trapped between the moving average lines.
Binance Coin price long term forecast: bullish
Buyers will try to keep the price above the moving average lines. As a result, BNB will rise and try to reach its previous high of $340. BNB has reached a high of $326 today, but is limited by the moving average line. BNB/USD will be forced to move in a range for days before the moving average lines are broken. The uptrend will resume when Binance Coin crosses the 21-day line SMA. After that, the price will rise to the overriding resistance of $340. Since February 3, buyers have failed to keep the price above the overhead resistance.
Binance Coin indicator display

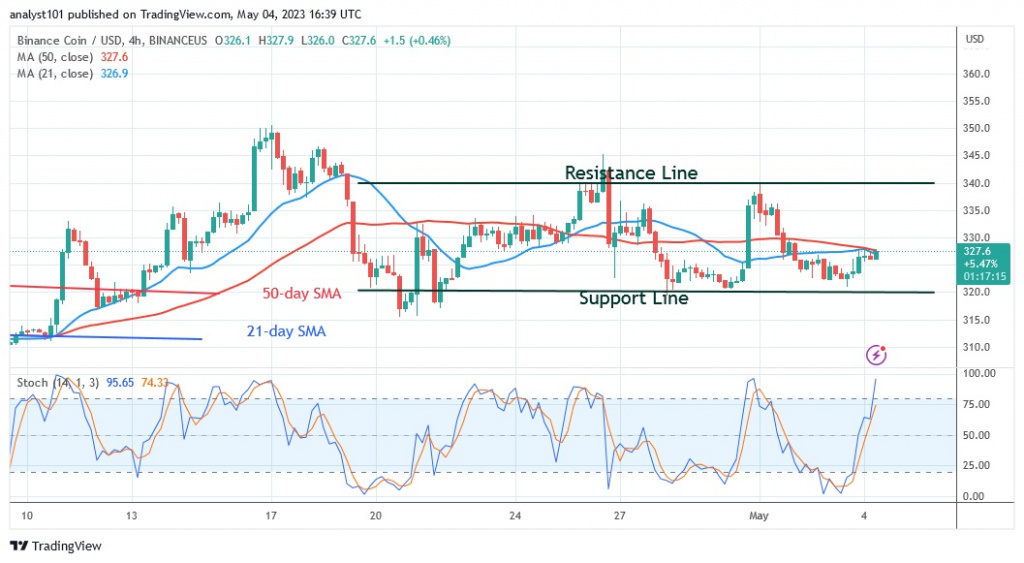
On the Relative Strength Index for period 14, BNB is at the level 50. The price of the cryptocurrency asset has reached a stable level. This indicates that the level of supply and demand is balanced. BNB is currently trending sideways as it trades between the moving average lines. BNB is in a bullish momentum above the Stochastic daily level of 70. The cryptocurrency is also approaching the overbought zone. This will stop the uptrend.
Technical indicators:
Key resistance levels – $600, $650, $700
Key support levels – $300, $250, $200
What is the next direction for BNB/USD?
BNB/USD is currently trading between $320 and $340 per unit and is mainly moving sideways. Neither the bulls nor the bears have cracked the range bound level. The altcoin is currently trading below the moving average lines on the 4-hour chart. It is also approaching the overbought zone of the market.
Disclaimer. This analysis and forecast are the personal opinions of the author and are not a recommendation to buy or sell cryptocurrency and should not be viewed as an endorsement by CoinIdol. Readers should do their research before investing in funds.
Source: Read Full Article