$BTC: Popular Crypto Analyst Points to Bullish Pattern Suggesting Bitcoin Could Trade at $80,000 Next Year
A popular cryptocurrency analyst has pointed to a bullish chart pattern that suggests the price of the flagship cryptocurrency Bitcoin ($BTC) could trade at the $80,000 mark by next year if it plays out.
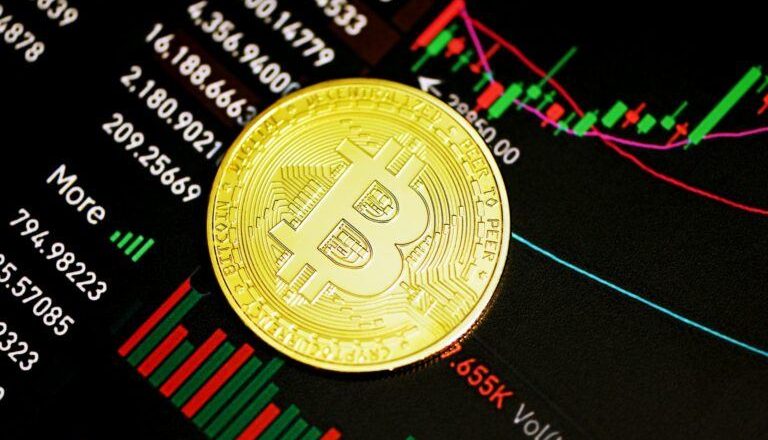
In a tweet shared with their over 30,000 followers on the microblogging platform, popular pseudonymous cryptocurrency analyst Moustache noted that Bitcoin has formed what he called a “bullish megaphone pattern,” with a price target around the $80,000 mark.

The pattern Moustache pointed to is seemingly a broadening formation pattern, which is characterized by increasing price volatility and created with two diverging trend lines, with one rising and one falling, forming what appears to be a megaphone.
According to Investopedia, a broadening formation occurs when a “market is experiencing heightened disagreement among investors over the appropriate price of a security over a short period of time” as buyers become willing to buy at higher prices, while sellers find motivation to take profits.
As the formation is characterized by growing volatility without a clear direction, it’s often seen as bearish. In a separate tweet, however, Moustache pointed out BTC’s price action is now similar to the one seen between June and September, but in a tighter range suggesting “bears are weakening, which is a sign of a bottom structure.”
Per his words, a similar formation could be seen back in 2015 and 2018, before BTC’s price entered a bull run and surged.
Despite the lower volatility, CryptoCompare data has suggested an accumulation trend is ongoing amid investors of varying sizes. The trend is in contrast to the last cryptocurrency bear market, in which holders across different wallet sizes were panic selling their tokens.
As detailed in CryptoCompare’s 2022 Outlook Report, Bitcoin accounts with over 10,000 BTC holdings have seen an increase which is likely a result of growing institutional adoption.

The accumulation trend is being seen even at a time in which bitcoin and cryptocurrencies have so far failed to act as an inflation hedge, bringing into question a long-proposed narrative by digital asset natives.
So far this year, both BTC and ETH have performed inversely to inflation and nominal interest rates. Bitcoin’s volatility has been steadily stabilizing in a bounded range compared to the last bear market. During the last bear market, in 2018, BTC’s average annualized volatility was 79%, while it’s now at 63%.
Image Credit
Featured Image via Unsplash
Source: Read Full Article