
Schools that Excel 2023: Find out your school’s results
Save articles for later
Add articles to your saved list and come back to them any time.
Welcome to the fifth edition of Schools that Excel, an annual series in which The Age celebrates schools that achieve outstanding improvement in their VCE results.

The series examines VCE data from 2013 to 2022.
The Age has gathered VCE results data going back over that 10-year period for every secondary school in the state and turned it into an easy-to-use dashboard to show how each school fared, what its graduates do after finishing, and more.
Enter the name of your school to see the results.
Two of the past 10 years were dominated by the disruption caused by the COVID-19 pandemic. The Victorian Curriculum and Assessment Authority applied special consideration to results for 2020 and 2021.
In 2022, a derived score was given to students identified by schools as significantly affected by floods.

Principal Rob Pyers and students from Horsham Secondary College.Credit: Jason South
As always, the hard work of Victorian students, teachers and school communities has shone through.
After a few years of hardship, many schools are taking a more holistic approach to their teaching, embracing a vision for lifelong learning and taking a practical approach to preparing students for what lies beyond the school gates.
As Horsham Secondary College principal Rob Pyers says: “Success for me is certainly made up of an ATAR, but it’s also the trainee, the apprentice. It’s the quality of person who actually leaves your school”.
Horsham won the Schools that Excel government award for Victoria’s regional area.
Anesti Anestis, principal of the northern government winner Bundoora Secondary College, says the results are just a “pleasant byproduct” of the school’s resurgence.
“The result isn’t what drives us,” he says. “Kids finding their passion, their purpose and taking those next steps confidently with a high degree of independence and a high degree of resilience. That’s what we’re on about.”
For Anna Negro, principal of regional non-government school winner Sacred Heart College, the ultimate goal is for students to contribute to making the world a better place.
“I keep saying that I know that we are successful if we have our young people sitting at the table where decisions are being made,” she says.
The Schools that Excel interactive brings together detailed results from Victorian government, independent and Catholic schools.
What can I learn from this interactive?
The interactive lets you gauge a school’s VCE performance over 10 years, so you can see whether it has improved or maintained its results.
When VCE results are released in December, only the current year's figures are provided. That information is useful, but it doesn't tell you anything about how representative the results are of the school's typical performance. By threading together data from the past decade, a much clearer picture emerges.
You can also see how students enrolled in VET or VCAL programs fare, and whether they continue on to vocational education or apprenticeships. Not all schools cater to students who are predominantly after a place at university, and the Schools that Excel dashboard reflects this.
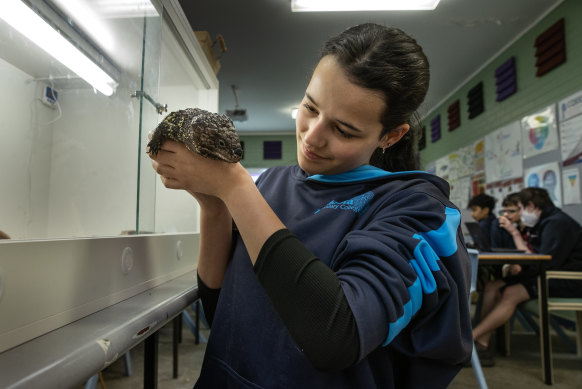
Bundoora Secondary College student Aaliya Da Silva with Meatloaf in the school’s reptile enclosure.Credit: Simon Schluter
What does the dashboard show?
The information about each school is divided into several panels. Here is a guide to interpreting the data:
Average student performance shows the median VCE subject study score for the school since 2013, which is a good indicator of typical student achievement. Study scores are out of 50, and a 30 is the average. The horizontal line at 30 on the graph is the yardstick that shows how the typical student at this school fares against the statewide average.
The interactive does not show median ATARs because this data is not available for the past decade for each school.
High achievers shows the percentage of the school’s VCE subject scores that were among the best in the state. These are scores of 40 or above, which put students within the top 10 per cent of all those who completed that VCE subject. This panel also shows the subjects in which students obtained the best results.
Completion rates shows the enrolment numbers in VCE, VET and VCAL over the past five years, as well as the satisfactory completion rates among year 12s. Unfortunately, data was not released on VET completion rates in 2021, which is highlighted in the interactive.
Student pathways shows what 2021’s year 12 graduates were doing midway through last year – whether they had gone on to further study at university or TAFE, or whether they had taken on an apprenticeship or joined the workforce. This panel does not show up if a high percentage of a school’s year 12 graduates did not complete the survey. The survey results have not yet been published for 2022’s graduates, so 2021 is the latest year for which data is available.
School awards shows the 10 high-gain schools that The Age judged as having shown the best improvement in their results over the past decade.
Which schools are featured in the dashboard?
The interactive dashboard features data on more than 500 Victorian schools that offered VCE, VET or VCAL programs in 2022.
It also includes schools that were classified by the VCAA as “small” for having enrolments below a certain threshold. A dialogue box will pop up in the interactive if you enter the name of a small school to flag that its performance may not be comparable with larger schools and that it may not be possible to observe a trend in results over the 10-year time frame. If a school has few students, it means the median can fluctuate greatly year-on-year depending on the cohort.
Which schools do not feature in the interactive?
Schools for which there is insufficient data, schools that exclusively offer the International Baccalaureate, and adult education institutions do not show up in the interactive.
There might also be gaps in the data for years in which student enrolments did not reach a certain threshold.
How were the Schools that Excel awards decided?
We used Department of Health boundaries to categorise schools as metropolitan or regional and divided the metropolitan region into west, north, east and south Melbourne.
One government school and one non-government (Catholic or independent) school was chosen for each area based on their records of improvement.
The Morning Edition newsletter is our guide to the day’s most important and interesting stories, analysis and insights. Sign up here.
Most Viewed in National
From our partners
Source: Read Full Article