Quant Recovers Above $106 But Vulnerable To Further Declines
Quant (QNT) price has remained consistently below the moving average lines.
Quant long-term price forecast: in the range
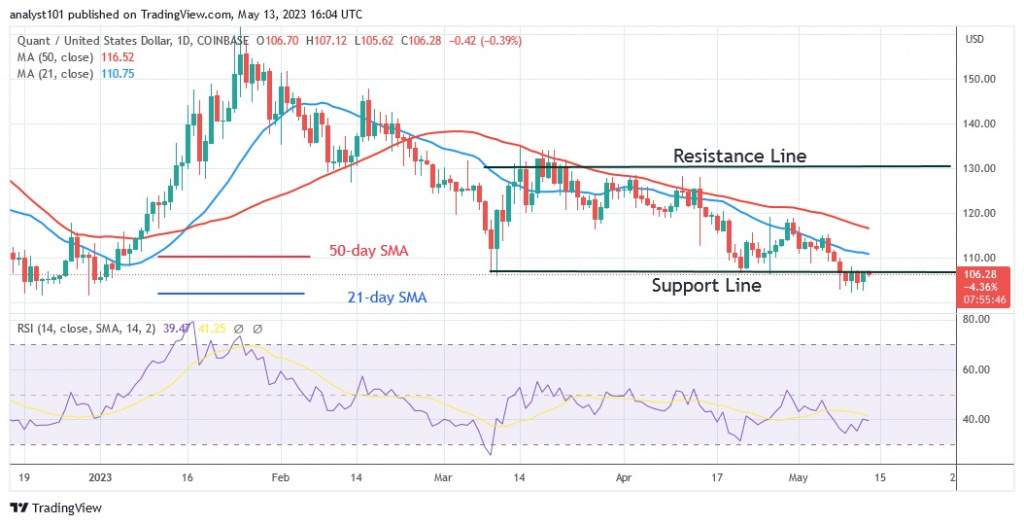
On May 8, the cryptocurrency reached a low of $102, after which consolidation resumed above this level. The price of the cryptocurrency has not changed much today, but as of this writing, it is at $106. On the negative side, the price of the cryptocurrency has remained constant at $106 since March 9. The current support was broken by the bears on May 8, but the bulls bought the dips. The cryptocurrency value has returned to its old trading range between $106 and $130. The 21-day line SMA prevents the cryptocurrency from moving higher. However, a price recovery will help QNT restore positive momentum.
Quant price indicator analysis
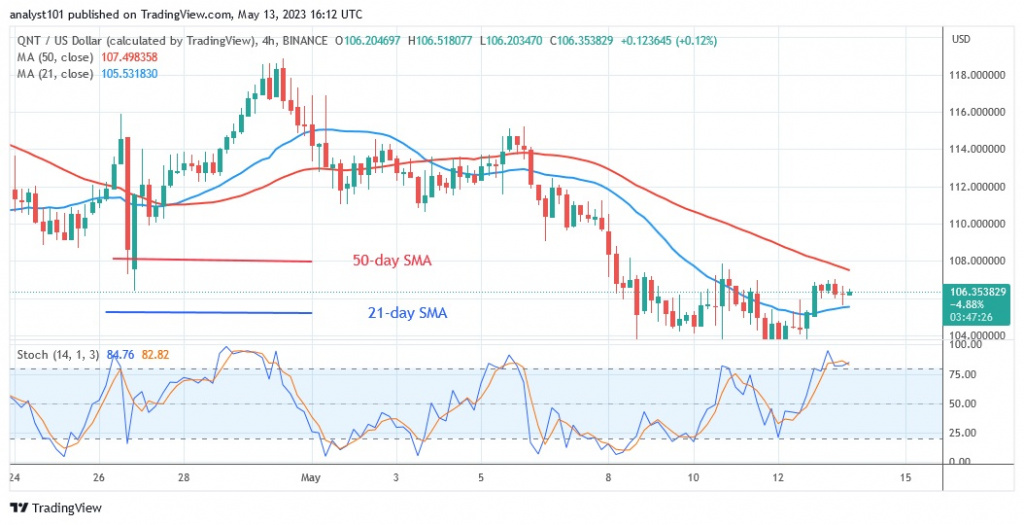
The cryptocurrency is trading at level 39 of the Relative Strength Index for period 14 and is in the bearish trend zone. In the bearish trend zone, QNT is vulnerable to further declines. With the price bars below the moving average lines, the value of the altcoin will continue to decline. The daily stochastic value of 80 is above the cryptocurrency’s price. The overbought zone has been reached by the market. The overbought area will reject the altcoin.
Technical indicators
Key supply zones: $140, $150, $160
Key demand zones: $120, $110, $100
What is the next step for Quant?
QNT/USD has been moving in a range between $106 and $130. If the bears break the current support and the negative momentum continues, the altcoin will come under further selling pressure. The cryptocurrency is trapped between the moving average lines on the lower time frame. This suggests that the altcoin will have to move in a range for a few more days.
Disclaimer. This analysis and forecast are the personal opinions of the author and are not a recommendation to buy or sell cryptocurrency and should not be viewed as an endorsement by CoinIdol. Readers should do their own research before investing in funds.
Source: Read Full Article


