Quant Is In A Span As It Resumes Its Sideways Movement
Cryptocurrency analysts of Coinidol.com report, the price of Quant (QNT) is falling, but it has reached bearish exhaustion.
Quant price long term forecast: bearish
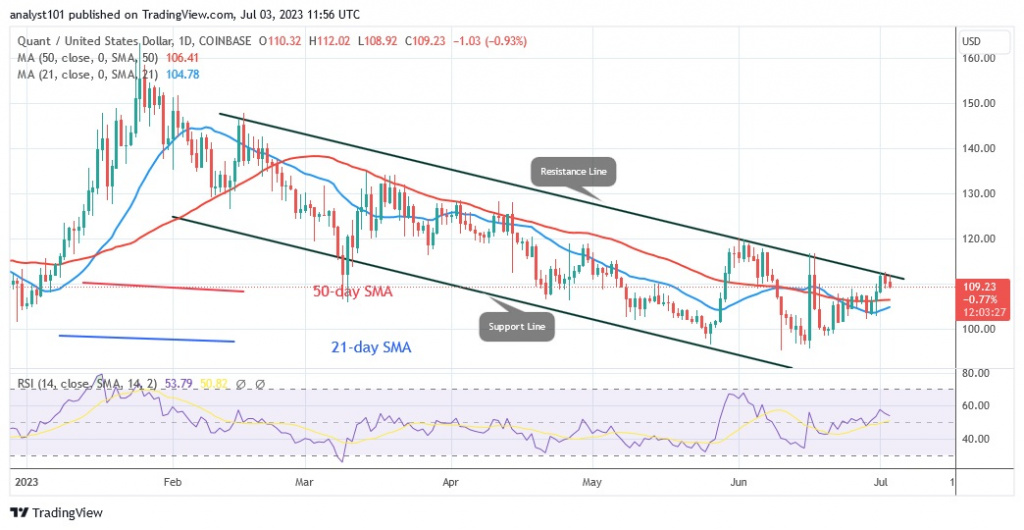
Since May 26, selling pressure has eased and the cryptocurrency has resumed its sideways movement. The altcoin was trading between $96 and $116. The altcoin was unable to continue its uptrend due to the barrier above $116. At the time of writing, QNT is trading at $108.99. Should buyers break through resistance at $116, the altcoin could rise to a high of $130. If the bears break below the 96 support, the downtrend will resume.
Quant price indicator analysis
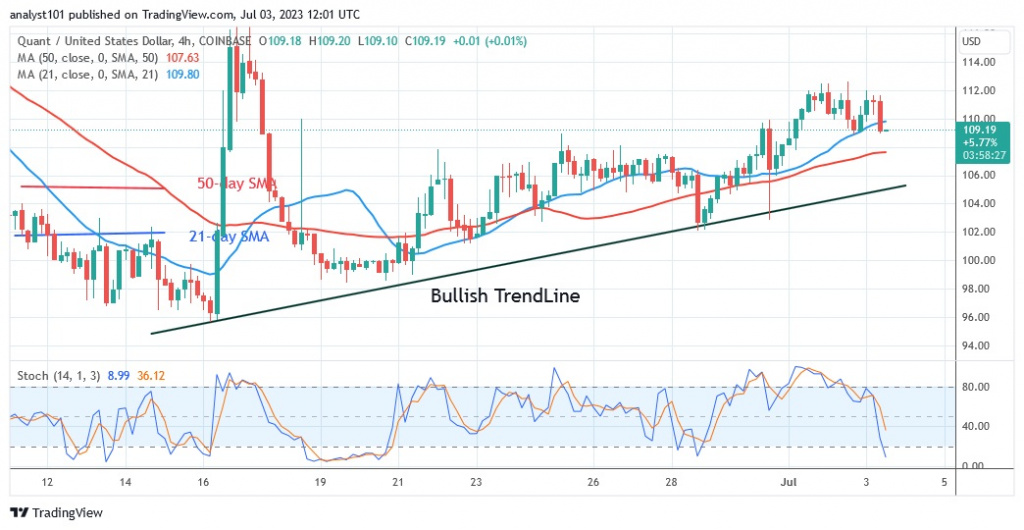
QNT is at the level of the Relative Strength Index 53 for the period 14. With the break above the moving average lines, the altcoin enters the positive trend zone. As long as the price bars are above the moving average lines, the cryptocurrency will rise. QNT falls below the daily stochastic value of 40, which indicates a downtrend.
Technical Indicators
Key supply zones: $140, $150, $160
Key demand zones: $90, $80, $70
What is the next move for Quant?
Quant will continue to move sideways, fluctuating between $96 and $116. The altcoin is currently trading above the moving average lines and is retesting the $116 resistance level and will retest the $96 support after being rejected at the last high.
On Jun 24, 2023, Coinidol.com reported that: Quant is currently trading for $105.22 at the time of writing. As the altcoin struggles to maintain its position below the moving average lines, further upside appears doubtful.
Disclaimer. This analysis and forecast are the personal opinions of the author and are not a recommendation to buy or sell cryptocurrency and should not be viewed as an endorsement by CoinIdol.com. Readers should do their own research before investing in funds.
Source: Read Full Article


