Polkadot Retraces as It Revisits the $9.20 Overhead Resistance
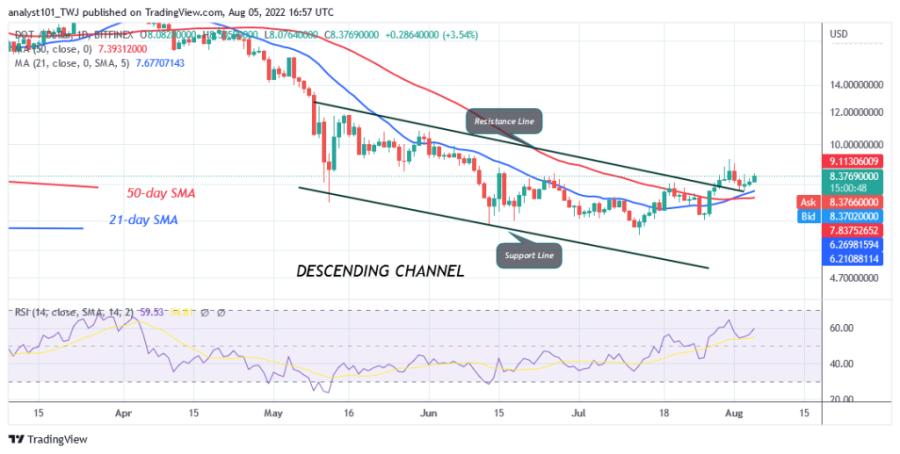
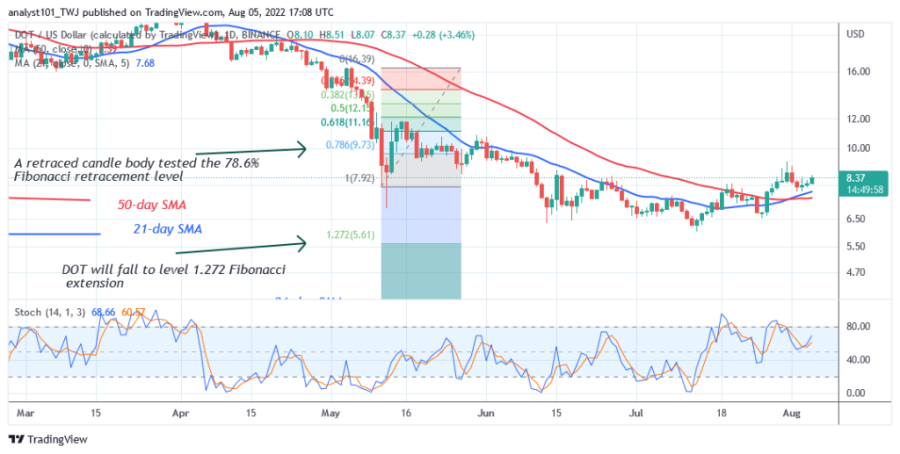
Polkadot (DOT) is trading above the moving average lines and continues its uptrend. On July 31, DOT uptrend was halted at the $9.20 high as buyers failed to break above resistance.
The cryptocurrency is holding above the $7.68 support or above the moving average lines. In the bullish trend zone, prices tend to move upwards.
If the bulls break the resistance at $9, Polkadot will rise to $10.80 and $12. On the other hand, if the bulls break the upper resistance, the altcoin will decline and find support above $7.68. If the price declines and falls below the moving average lines, the altcoin will continue to fall to the low price level of $6.52.
Polkadot indicator analysis
The cryptocurrency is at level 60 of the Relative Strength Index for period 14, which indicates that the price is in the bullish trend zone and could continue to rise. The price of the altcoin is above the 21-day line SMA and the 50-day line SMA, which indicates further upward movement. DOT is above the 60% area of the daily stochastic. The market is in a bullish momentum.
Key Resistance Zones: $10, $12, $14
Key Support Zones: $8.00, $6.00, $4.00
What is the next direction for Polkadot?
Polkadot is in an uptrend as it has a bullish momentum again. The current uptrend is encountering resistance at the $9.00 high. The uptrend will resume when resistance is broken. In the meantime, the cryptocurrency is fluctuating above the moving average lines for a possible upside move.
Disclaimer. This analysis and forecast are the personal opinions of the author and are not a recommendation to buy or sell cryptocurrency and should not be viewed as an endorsement by CoinIdol. Readers should do their research before investing funds.
Source: Read Full Article


