Polkadot Consolidates Above $4.00 And Reaches An Oversold Region
Polkadot (DOT) is in a downtrend and has dropped to the bottom of the chart.
Polkadot price long-term analysis: bearish
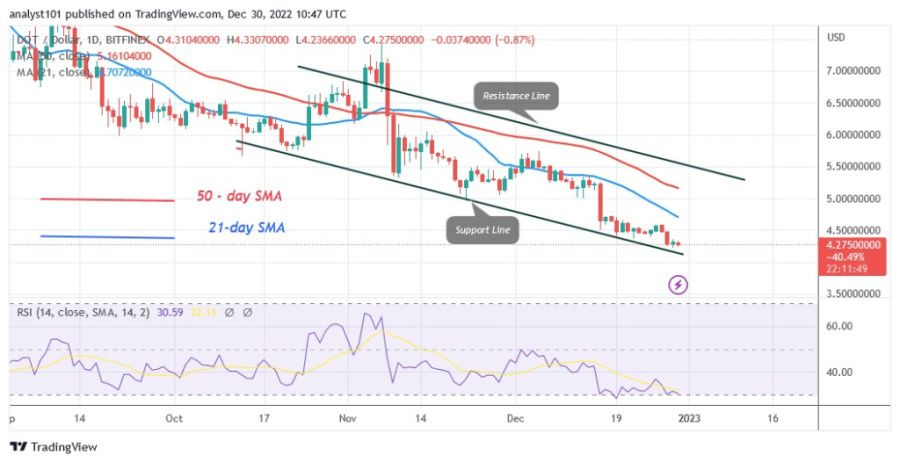
Since reaching a high of $53.87, the cryptocurrency asset has been steadily losing value. At $4.27, the price of DOT is at an all-time low. The previous price level of October 12, 2020 is being tested again by the current price level. The previous price action has held the current support level. On the downside, Polkadot will decline but can reverse above the $4.00 support. The cryptocurrency has reached the oversold zone of the market. Further downward movement of the cryptocurrency is unlikely.
Polkadot indicator analysis
For the period 14, the Relative Strength Index is at 30. The bear market for cryptocurrencies has run its course. The altcoin market is already oversold. The placement of the price bars below the moving average lines indicates that the price will continue to decline. The SMAs of the 21-day and 50-day lines are pointing south.
Technical indicators
Key resistance levels – $10 and $12
Key support levels – $6 and $4
What is the next direction for Polkadot?
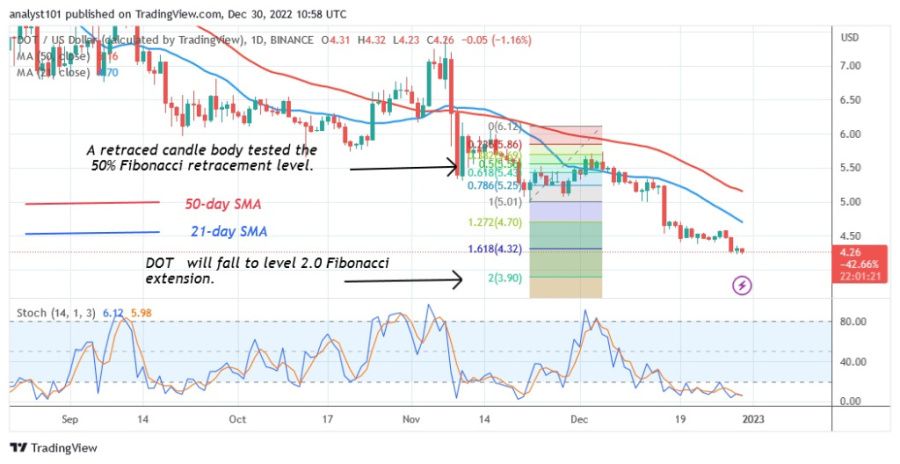
As the market begins to consolidate back above current support, Polkadot is trading at the bottom of the chart. The price of DOT corrected higher during the downturn on November 22, and a candlestick tested the 50% Fibonacci retracement level. The correction states that DOT will fall to the 2.0 Fibonacci extension level, or $3.90.
Disclaimer. This analysis and forecast are the personal opinions of the author and are not a recommendation to buy or sell cryptocurrency and should not be viewed as an endorsement by CoinIdol. Readers should do their research before investing in funds.
Source: Read Full Article


