Monero Price Stagnates, How Soon Will It Cross This Obstacle?
Over the past couple of months, the price of Monero has appreciated significantly. However, in the last week, the altcoin’s price action has dulled out, and XMR has been unable to secure significant gains.
Although Monero gained just 1.5% over the last 24 hours, it noted a sharp recovery from the $140 zone to $180 at the beginning of this year, but the bulls could not sustain the recovery.
Since recovering from the $130 mark, the coin has been attempting to rise on its chart, but the daily outlook of XMR shows mixed signals.
Although buying strength is positive, it is not significant. Buyers are still in control of the price, and demand is present, which reflects an increase in accumulation.
XMR’s price depends on Bitcoin surpassing the $29,000 price to move closer to its immediate resistance. If XMR remains constricted over the next trading sessions, there is a possibility that the bulls may tire out.
This would result in a price drop to its local support. The market capitalization of XMR has noted an uptick, displaying demand on the daily chart.
Monero Price Analysis: One-Day Chart
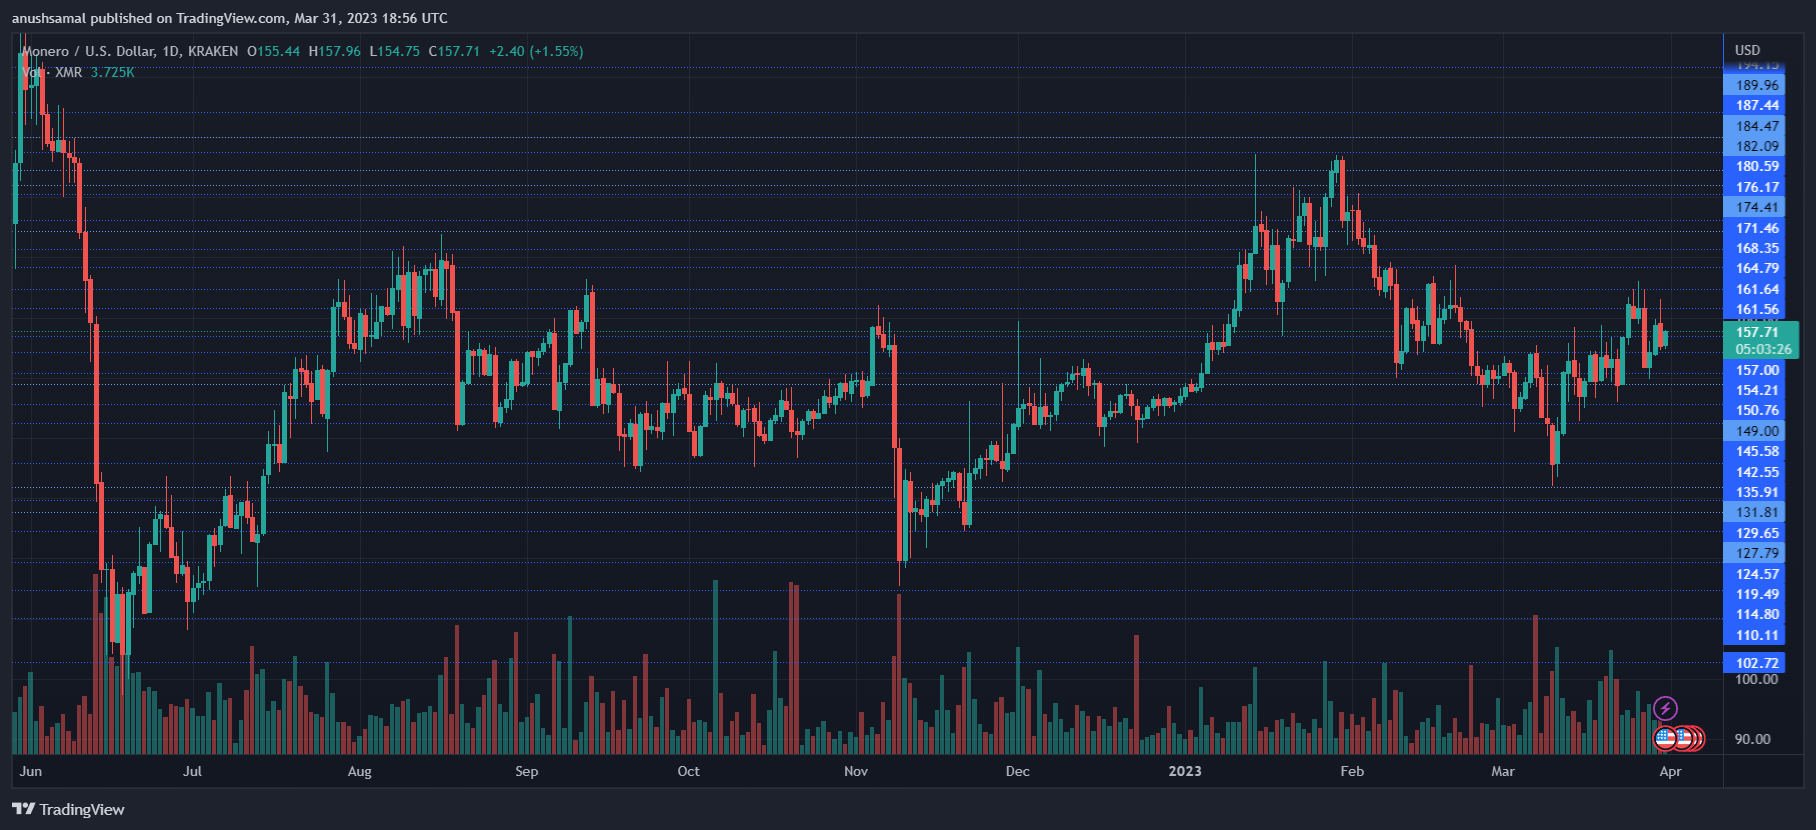
XMR was trading at $157, with overhead resistance for the coin at $161. The buyers would need a push to help the altcoin breach the above level. However, even if XMR crossed the $161 mark, the bulls would not be secured unless it trades past the $168 price mark.
On the flip side, support for XMR rested at $154. The inability to hold the price at that level would drag Monero to $148. The amount of Monero traded in the last session was green, depicting an increase in buying strength on the one-day chart.
Technical Analysis
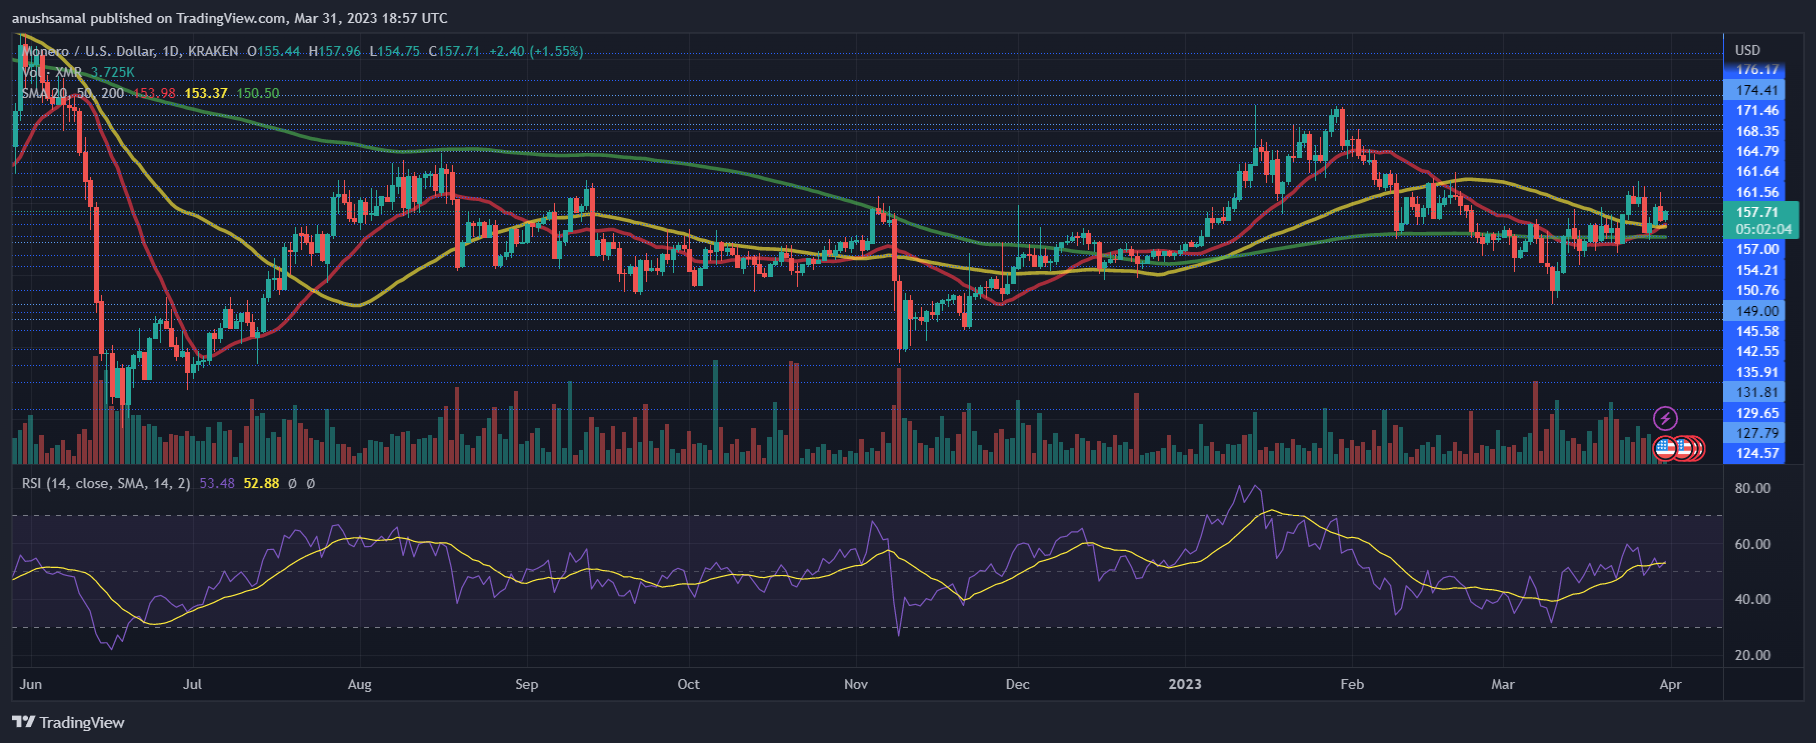
As XMR moved above the $154 zone, the altcoin began to note a slight recovery in buying strength. The Relative Strength Index indicated an upswing from the half-line, suggesting buyers were gaining strength on the daily chart.
Additionally, the XMR price moved past the 20-Simple Moving Average line, indicating that buyers were in control and driving the price momentum in the market. Furthermore, XMR was above the 50-SMA (green) line, which suggests a chance of continued bullishness.
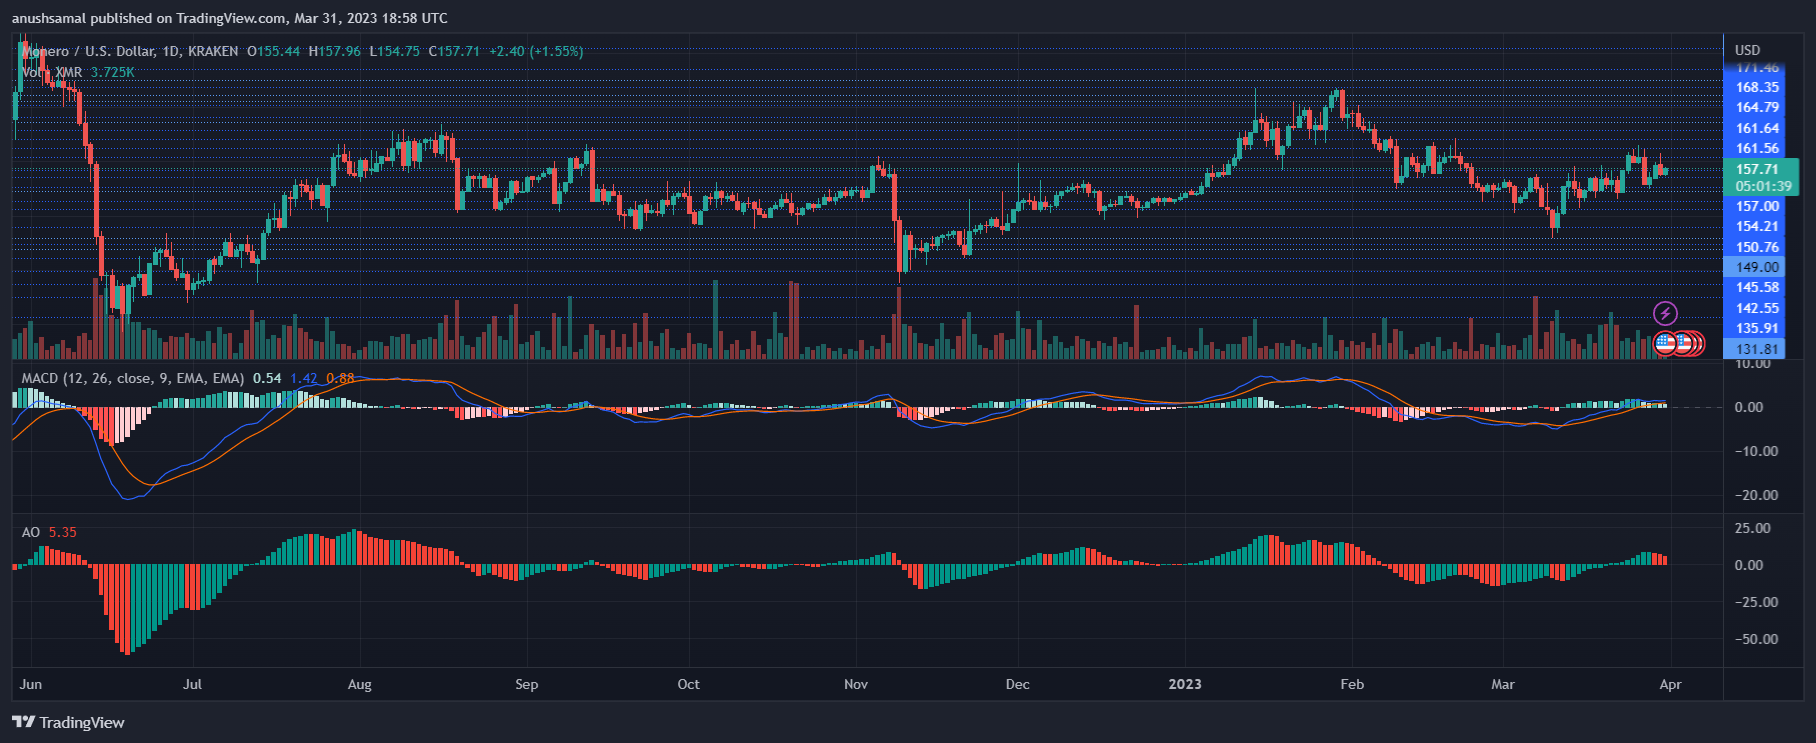
The buying sentiment in the market remained strong as the price action on the chart was positive. The Moving Average Convergence Divergence (MACD) indicator, which indicates the price momentum and change, was positive and displayed green histograms, signaling a buy signal for the coin.
On the other hand, the Awesome Oscillator (AO) reads the price trend, and although there was a recovery in buying strength, the indicator did not reflect the positive change just yet. The indicator portrayed red bars, signifying negative buying strength, although these bars were declining in size.
Source: Read Full Article


