Chainlink Trades in a Tight Range but Struggles below $6.75 High
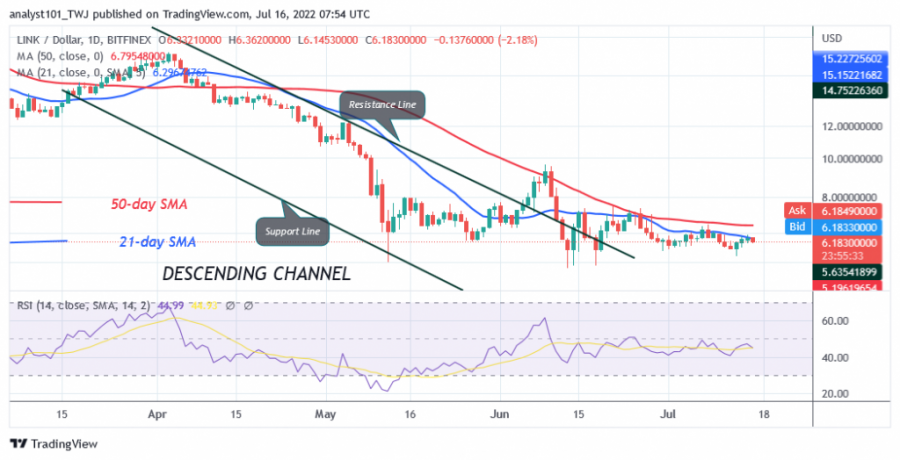
The price of Chainlink (LINK) is in a downward correction as it trades below the moving average lines. Today the altcoin turns from the 21-day line SMA.
This is an indication that the bears are still in control of the price. The altcoin could fall to the current support at $5.31. This is the price action since June 13.
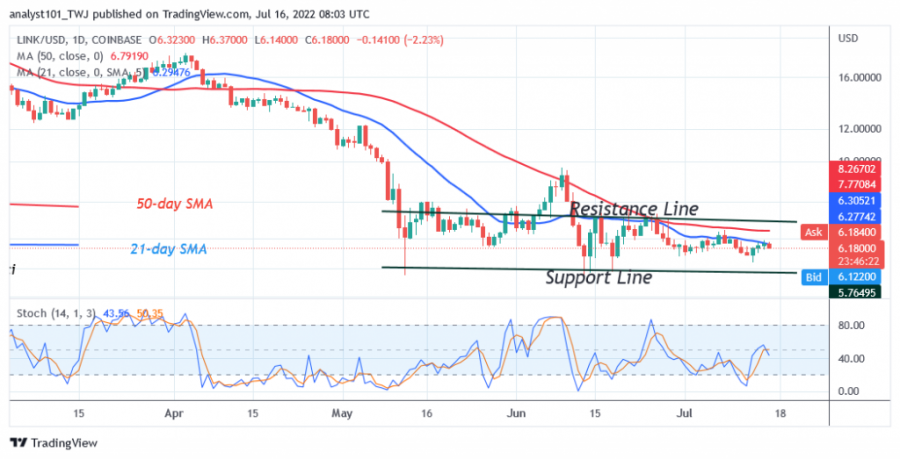
Last month, the 21-day line SMA prevented further upward movement of the altcoin, hence the current fluctuation below the moving average lines. In the same sense, buyers have defended the current support since May 12. The current support at $5.31 is marked by long candlestick tails. The long candlestick tails show strong buying at lower price levels. Chainlink will change if current support is broken or the 21-day line SMA provides resistance.
Chainlink indicator reading
Chainlink is at level 45 of the Relative Strength Index for the period 14, indicating that the altcoin is in a downtrend and could continue to decline. The price movement was marginal due to doji candlesticks. The altcoin’s price bars are below the moving average lines, indicating a price decline. LINK is below the 40% area of the daily stochastic. The bearish momentum is volatile.
Technical indicators:
Major Resistance Levels – $30 and $35
Major Support Levels – $10 and $5
What is the next move for Chainlink?
Chainlink is in a sideways movement. The altcoin has narrowed in the tight range between $5.30 and $7.30 levels. In the meantime, the price action is dominated by small indecisive candles (doji). These are responsible for the current movement within the trading range.
Disclaimer. This analysis and forecast are the personal opinions of the author and are not a recommendation to buy or sell cryptocurrency and should not be viewed as an endorsement by Coin Idol. Readers should do their own research before investing funds.
Source: Read Full Article


