Bitcoin Cash Is in a Range-Bound Move Between Levels $87 and $109
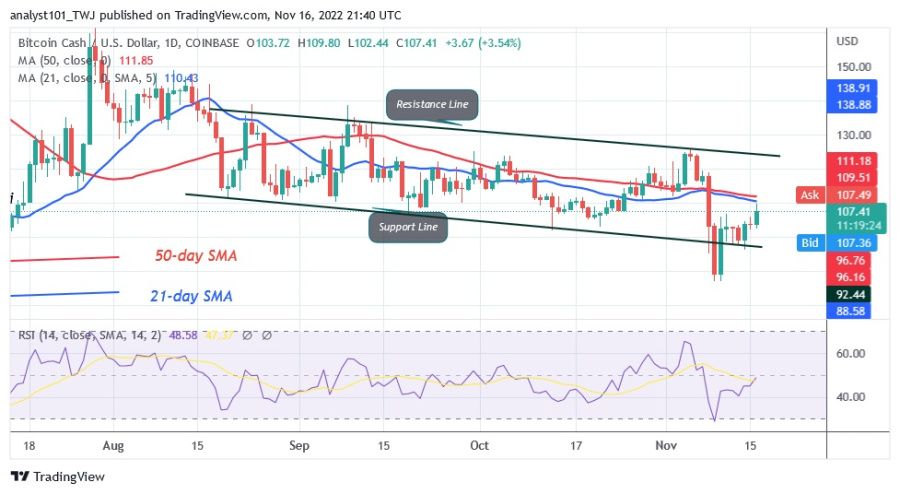
The price of Bitcoin Cash (BCH) is in a downtrend after falling to a low of $87 on November 9. The current support held last week as the altcoin resumed its upward correction.
The altcoin reached a high of $106 during the first upward correction before retreating. BCH rose to a high of $109 during the second upward correction but remained below the moving average lines. BCH will return to the highs of $124 or $138 if buyers keep the price above the moving average lines. However, an upward movement is unlikely as the cryptocurrency is in an overbought zone. If buyers fail to keep the price above the 21-day moving average line, BCH will fall and return to a range between $87 and $109.
Bitcoin Cash indicator reading
The Relative Strength Index for BCH has increased to the value of 45 for the period 14. This is due to the recent upward correction that was staved off at the 21-day moving average. The price bars are below the moving average lines, which indicates that the altcoin will continue to fall. Bitcoin Cash’s daily stochastic is below the 40 level. BCH is bearish.
Technical Indicators
Key Resistance Zones: $160, $180, $200
Key Support Zones: $120, $100, $80
What is the next direction for BCH?
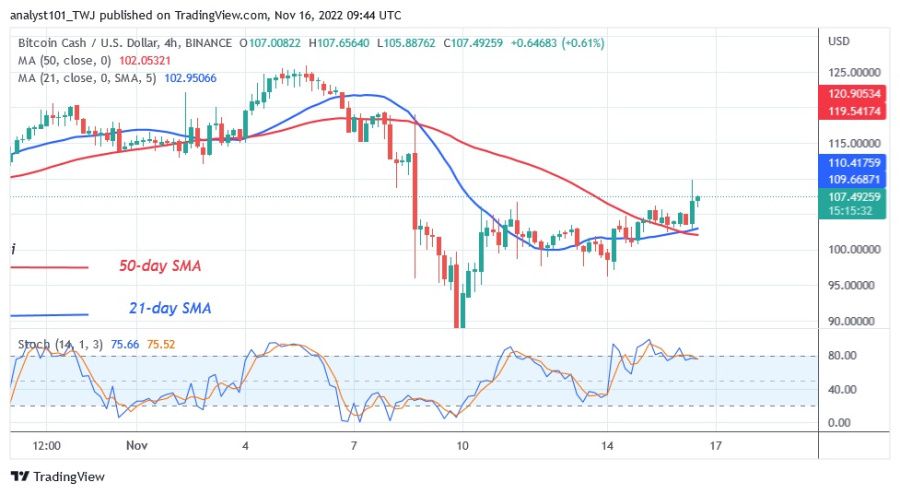
The 4-hour chart for Bitcoin Cash shows a horizontal trend. The value of the cryptocurrency fluctuates between $96 and $109. Doji candles, which have small bodies and are indecisive, determine the price movement. These candles show that both buyers and sellers are uncertain about the direction of the market.
Disclaimer. This analysis and forecast are the personal opinions of the author and are not a recommendation to buy or sell cryptocurrency and should not be viewed as an endorsement by Coin Idol. Readers should do their own research before investing in funds.
Source: Read Full Article


